Background: Adequate documentation of patient diagnoses is essential for hospitals to capture the extent of services provided, to submit bills, and ultimately receive payment. These diagnoses are used to calculate hospital performance as part of the Hospital Readmission Reduction Program. Diagnoses taken from medical record documentation are also used to place patients in diagnosis-related groups (DRG). The average DRG weights of hospital inpatient discharges are used to calculate hospital case mix index (CMI). While it has been suggested that better documentation may have contributed to readmission reductions, this relationship has not been explored at the national level. Therefore, we examined the relationship between CMI (as surrogate for improved documentation) and hospital readmission rates with data from all hospitals in the United States.
Methods: We used the Center for Medicaid and Medicare Services (CMS) dataset of all eligible U.S. hospitals to determine the relationship between a hospital’s CMI and readmission rates for pneumonia, heart failure (HF), and acute myocardial infarction (AMI). Because CMS reports readmission data as a three-year moving average, we used five non-overlapping periods (from 2005 to 2019, the last year data was reported) and calculated corresponding three-year average of case-mix index for each hospital. General linear mixed models (i.e. occasions nested within hospitals, and hospitals nested within states) were used to examine predictors of readmission due to the three health conditions; pneumonia, HF, and AMI. Because the main predictor, CMI, was a time-varying variable, we incorporated it in the models as two variables; a mean-CMI variable calculated by taking the mean for the whole study period and a change-from-mean variable calculated by subtracting mean from each individual CMI observation. Models were adjusted for hospital ownership, teaching hospital status, bed count, nurses count, rural vs. urban location, total population of hospital service area (HSA), median age in the HSA, percentage of African Americans in HSA, medical income in HSA, median poverty percentage, and percentage of people with any insurance.
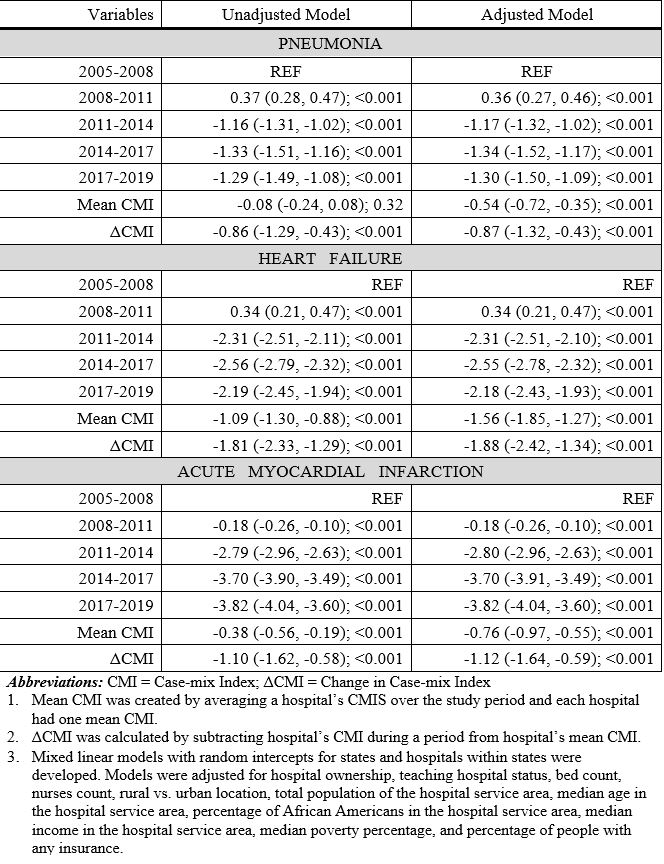
Results: Of the 3,372 hospital across the U.S., 73% were located in urban areas and 31% were teaching hospitals. At baseline (2005-08), mean readmission rates for pneumonia, HF, and AMI were 18.2%, 24.6%, and 19.9% respectively. Readmissions were significantly lower for all three conditions (pneumonia = 16.8%, HF = 21.9%, and AMI = 15.8%; all P< 0.001). On the other hand, there was a significant increase in CMI from 2005-08 to 2017-19 (1.40 vs. 1.64; P< 0.001). In adjusted models, hospitals with higher mean-CMI were associated with lower pneumonia (-0.54%; 95%CI = -0.72%, -0.35%; P< 0.001), HF (-1.56%; 95%CI = -1.85%, -1.27%; P< 0.001), and AMI (-0.76%; 95%CI = -0.97%, -0.55%; P< 0.001) readmissions. Similarly, change-from-mean CMI was associated with lower readmissions for all three conditions (pneumonia = 0.87%; 95%CI = -1.32, -0.43; P< 0.001, HF = -1.88; 95%CI = -2.42%, -1.34%; P< 0.001, AMI = -1.12%; 95%CI = -1.64% to -0.59%; P< 0.001) (Table).
Conclusions: We show that hospitals with higher mean CMI are associated with reduced hospital readmissions. Further, we show that increase in CMI during the study period are also associated with reduced readmissions. This analysis of national data suggests that at least part of the observed readmission reduction is due to improved documentation of diagnoses.