Background: Malnutrition, defined as deficiencies or excesses in nutrient intake, is associated with worse short and long-term outcomes compared to similar people without the diagnosis. The ASPEN or GLIM criteria are used to diagnose malnutrition, but these criteria are somewhat vague and measurement standards are typically not objective. The Inpatient Prospective Payment System considers severe malnutrition to be a major comorbidity, which increases reimbursement and modifies the risk adjustment for quality measures. Given the tension between challenges in accurately identifying malnutrition among hospitalized patients and financial incentives for documenting malnutrition in the medical record, we sought to evaluate trends in the prevalence of and outcomes of malnutrition over time.
Methods: We conducted a trends study of hospitalizations in the United States from 2016 until 2019 using the National Inpatient Sample (1). We excluded elective, surgical, and obstetric hospitalizations and limited the sample to patients aged 18 years or older. For each year, 2016-2019, we used ICD-10 diagnosis codes to classify cases as having no malnutrition, non-severe malnutrition, or severe malnutrition. Using ICD-10 procedure codes, we examined use of mechanical ventilation and PEG-tube placement in all three groups as well as rates of death. We calculated the Gagne comorbidity index using ICD-10 diagnosis codes. We used direct standardization by logistic regression to adjust rates of mechanical ventilation, PEG-tube placement, and death by age group, comorbidities, and gender per each malnutrition diagnosis category (2). We used linear regression to test for trend over time to evaluate changes in standardized rates per year.
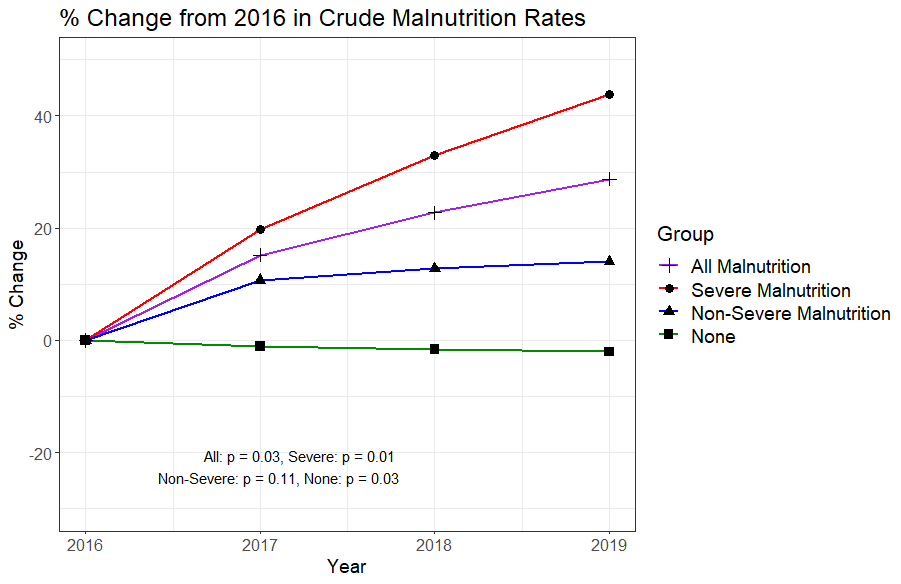
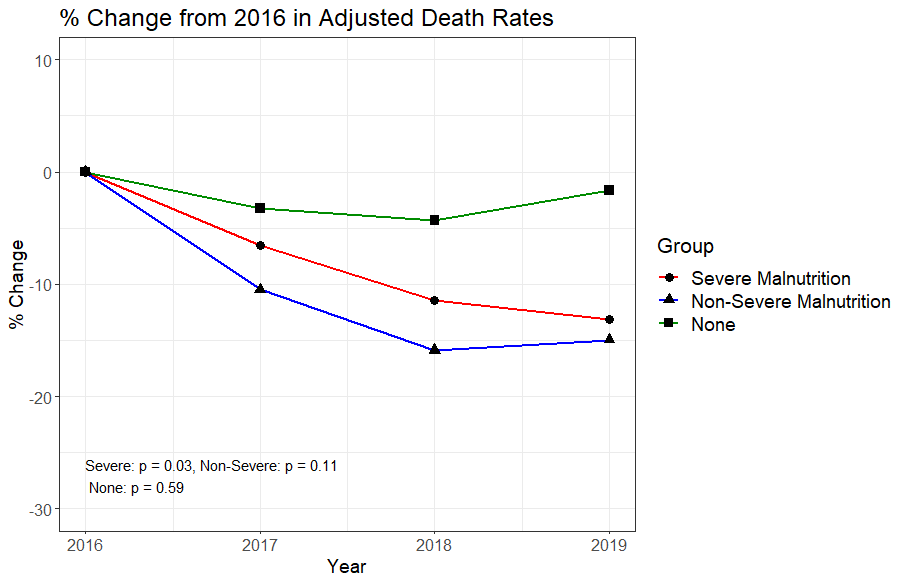
Results: Our sample included 66,265,884 ± 366,99l hospitalizations, of whom 7.8% received a diagnosis of malnutrition, including 3.7% with non-severe malnutrition and 4.1% with severe malnutrition. Over the study period, the presence of malnutrition increased 29%, from 6.64% of cases in 2016 to 8.55% in 2019 (p = 0.03). This was driven predominantly by changes in the diagnosis of severe malnutrition, which increased from 3.3% to 4.7% (p = 0.01). Compared to those without malnutrition, cases with severe malnutrition had higher crude rates of death (9.2% vs 2.3%, MSD = 29.97) across all years. Among those with severe malnutrition, however, there was a significant decrease in adjusted rate of death over time (-0.54% per year, p=0.03), and a decline in the rate of mechanical ventilation (-0.42% per year, p = 0.09). These changes were not observed among hospitalizations without malnutrition.
Conclusions: Between 2016 and 2019 the prevalence of malnutrition among hospitalized patients in the US rose 29%, driven largely by a 44% increase in the apparent presence of severe malnutrition (Figure 1). However, among the cases with severe malnutrition, adjusted mortality rates and severity of illness declined (Figure 2). This was not observed among those without malnutrition diagnoses. The dramatic increase in the prevalence of severe malnutrition codes combined with a concomitant decline in mortality raises the possibility that these trends reflect changes in use of malnutrition diagnosis codes, a lower threshold for applying a diagnosis of malnutrition, or assignment of the diagnosis to patients not previously labeled with this condition. Further research to clarify the diagnostic criteria for severe malnutrition in acute illness is needed.