Background: All oxygenation devices are the aerosol-generating procedures and can generate some contaminated aerosols and droplets from the patient’s airway and transmit them through the air, especially in close contact or in an enclosed space. Increasing the flow rate in O2 devices can provide more FiO2, such as using HFNC, which can improve the hypoxia situation but produce the dispersion of aerosols and droplets. There is ongoing debate about balancing the safety of medical staff with the efficacy of management. The study simulated aerosol dispersion and measured the aerosol concentration and distance when using different respiratory therapies.
Methods: A mannequin with a 30˚ head-up position was used to simulate the aerosol generated from the airway through a small ventilation at 20 L/min. Nasal cannula oxygenation (NC) with 4 and 15 L/min , non rebreather mask (NRM) with 15 L/min, simple mask with 6 L/min, combined NC with 15 L/min and NRM with 15 L/min, high flow nasal cannula (HFNC) with 50 L/min, and NRM with flush rate were used in this study. The dispersion distance was collected horizontally and vertically and captured using a high-sensitivity camera for ten minutes (Figure 1A). The aerosol concentrations in each group were also recorded from 0 to 10 min, yielding 1,500 samples. The 12,000 total enrolled data were defined as proportions by comparing the downstream aerosol concentrations (head, trunk, or foot) with upstream aerosol concentrations (mannequin mouth) which is shown on Figure 1B.
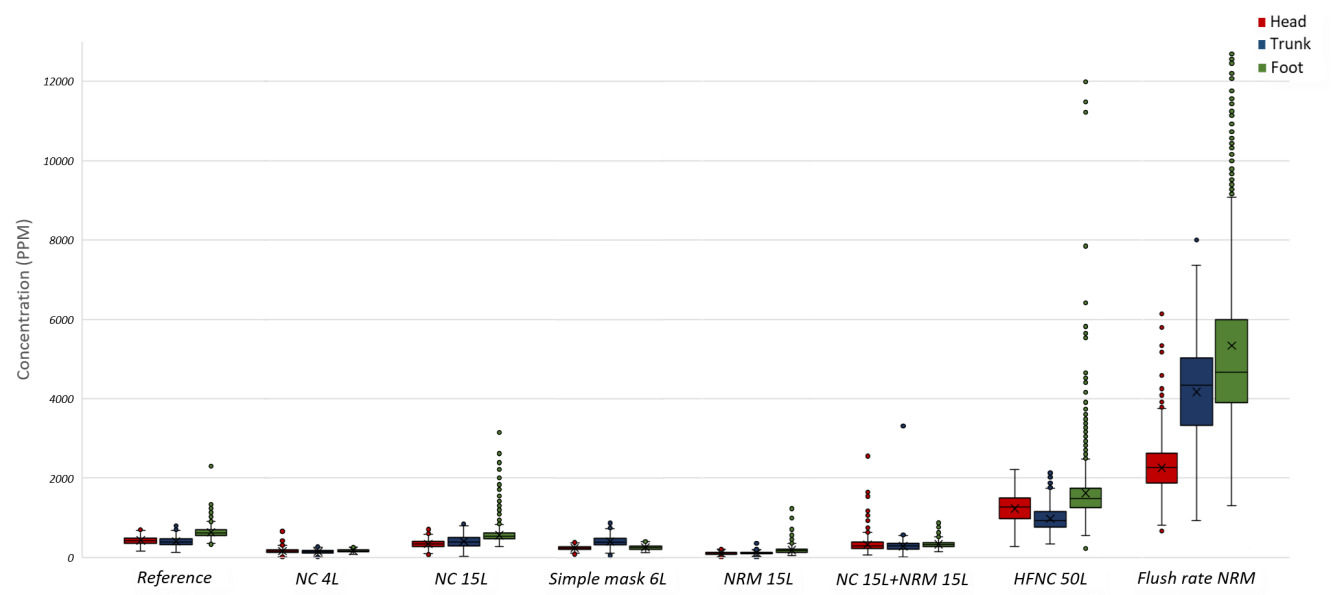
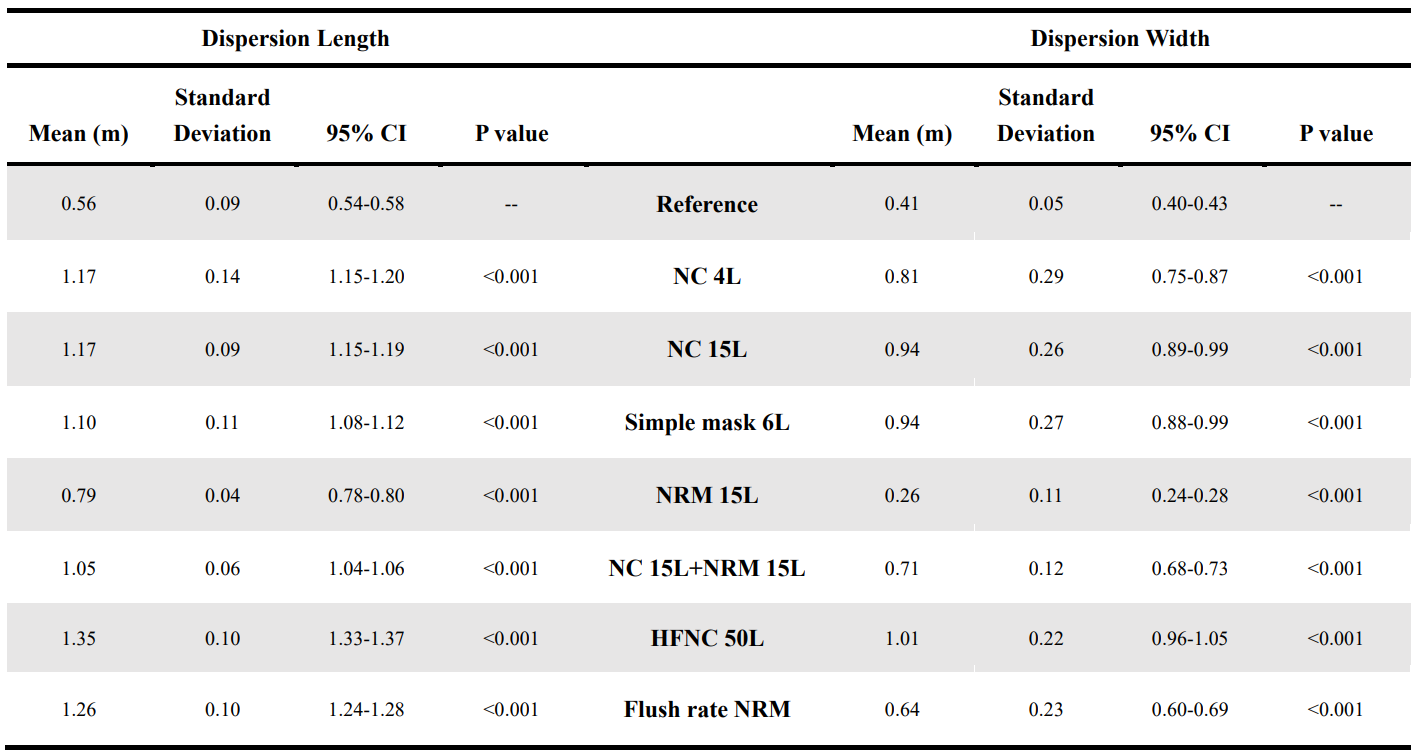
Results: The aerosol-dispersion distance (length and width) from the oxygenation devices was measured via the particle velocity technique (Table 1). The mean dispersion length and width of the aerosols without any oxygenation devices was 0.56 ± 0.09 and 0.41 ± 0.05 m, respectively; this was considered the reference group. For HFNC, the mean length and width of the aerosol-dispersion distance was 1.35 ± 0.10 and 1.01 ± 0.20 m, respectively, which were the longest among the seven methods and significantly differed from the reference and other groups (p < 0.001). We compared aerosol concentrations under the 8 oxygenation settings including 7 oxygenation delivering devices and the reference group (ie, no oxygenation) at the head, trunk and feet. Boxplots of the study characteristics are provided in Figure 2. Furthermore, concentrations at the foot were higher than which at the head or trunk under almost every oxygenation sitting. The values of reference group for specific concentrations were also higher at the foot comparing to the head-trunk area.
Conclusions: The dispersion distance of each oxygenation device increased , with HFNC demonstrating the highest dispersion distance. The aerosol concentrations were lower when the flow rate of the oxygenation devices was < 15 L/min or in the presence of mask effects, such as NRM and NC with NRM. However, the aerosol concentrations increased in high-flow oxygenation devices (i.e., HFNC and flush-rate NRM), which surpassed the mask effect, further increasing the aerosol contamination levels and the risk of infection. Furthermore, the aerosol concentrations were higher in the foot area vs. the trunk and head areas for all the oxygenation devices; thus, medical personnel should be more cautious around the foot area. We strongly recommend using personal protective equipment when treating patients, especially in closed spaces replete with infectious aerosol particles and for patients using high-flow oxygenation devices.