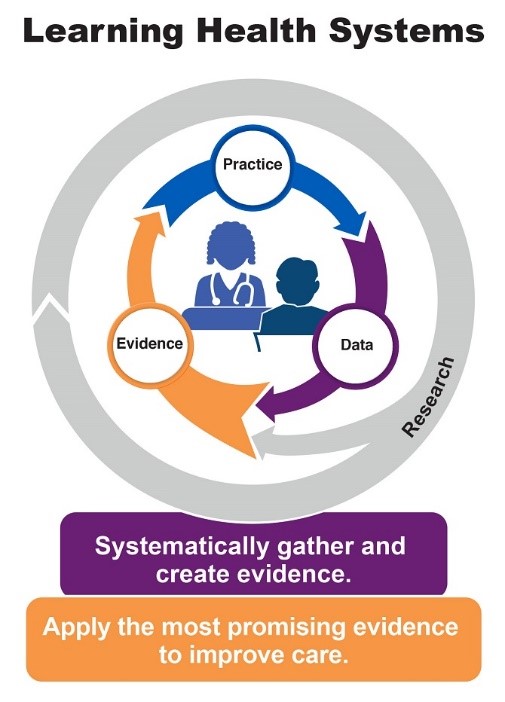
Background: Systematic and real-time gathering of data is central to the feedback loop to help providers guide and continuously improve their practice in a Learning Healthcare System (Figure 1). Despite these worthy goals health systems rely on Electronic Medical Record systems (EMRs) that make the routine collection and analysis of data for providers a laborious, convoluted, and costly task. The aim of this work is to describe the methods used to create a validated cohort of hospitalist medicine patients and daily provider level attribution of those patients for the basis of retrospective review and prospective real-time feedback so that other hospital systems may adopt and iterate on these techniques. We also report early observations in provider level practice variation.
Methods: Intermountain Health (Intermountain) is an integrated health system serving 7 states with 33 hospitals utilizing Epic, Cerner, and All Scripts EHRs. Intermountain has 3 regions, the Canyons region is a 21-hospital network supported by a Cerner based EMR. Prior to this work clinical questions required individual data queries by a range of data analysts using ad hoc methods that could not be systematically validated. A committee of data analysts, Hospitalist leadership, Informaticists, and Hospitalist researchers oversaw a project to unify a singular data query for retrospective validation of patient day level data followed by continuous prospective validation beginning in the Canyons region. Provider chart review at the patient day level retrospectively validated captured patient days for accuracy to care provided from our service. Next, attribution of each inpatient day was validated using the gold standard of clinician review, for identification of provider/patient interaction and established as an admission, daily, ICU transfer in/out, same day admit/discharge, or discharge encounter.
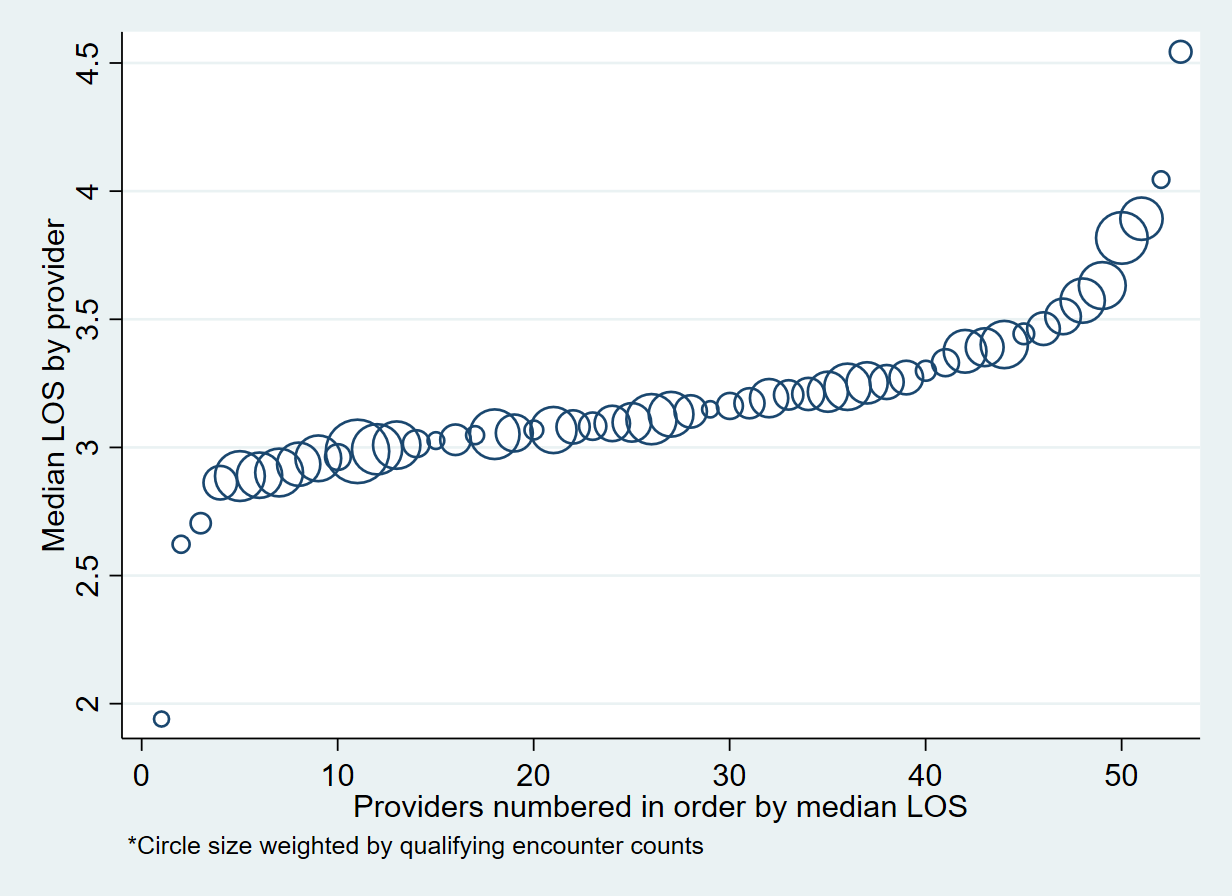
Results: The initial validation, using data from the largest hospital in Intermountain, assessed 1,561 unique patient days from 381 unique patients and was able to identify Hospitalist patients with 99.73% sensitivity and 99.97% specificity, compared to the gold standard. Daily provider/patient association was 98.47% sensitive and 99.80% specific. Compared with prior methods of patient identification we found 10% more patient days that prior methods and excluded 2% of false positives. Next steps are to expand query validation to other hospitals in the region and across Intermountain. We were able to immediately assess individual provider variation with the granularity of data and, as an example, find that median provider LOS in a sample of 17,954 encounters varies from 2 days to 4.5 days with most providers falling between 2.8 and 3.6 days (Figure 2). Attribution of LOS to individual providers uses a novel definition specifying the provider oversees encounter discharge and at least 30% of the inpatient encounter.
Conclusions: This method is an outline for health systems considering the creation of a cohort tool for identification of patients from any specialty provider service. We plan to use this data for internal real-time feedback for patient outcomes to our groups and individual providers. It is our hope that our reporting of these methods and future reports of variation in patient outcomes will support a Learning Healthcare System for Intermountain and ultimately provide an external measure for other health systems to assess and compare variation in provider processes and patient outcomes.