Background: Inpatient utilization of Magnetic Resonance Imaging (MRI) is rapidly expanding, with potential effects on length of stay (LOS). At the same time, current hospital occupancy remains about 10 percentage points higher than before the pandemic and hospitalizations are projected to increase 11% by 2034. Hospital systems are striving to optimize processes to improve bed capacity. The purpose of our project is to identify and address the causes of delays in MRI completion at our institution.
Methods: A survey of hospitalists and case managers at our academic safety net hospital located in South Texas identified delays in MRI testing as a top barrier to timely discharge. We partnered with our operational excellence team to apply lean methodology to this process improvement project. Our hospital chief operating officer sponsored the initiative, and a multidisciplinary team was convened. A process map was generated and causes of delays at each step identified. Redundant steps in the process were eliminated and new processes created to address the root causes (Fig. 1).Student t-tests were used to compare the weekly average time between the placement of an MRI order and the result entry in the Electronic Health Record (EHR) – defined as MRI turnaround time (TAT) – between pre- and post-intervention periods, and the times between order entry to exam started, exam started to exam ended, and exam ended to final report in the EHR. Statistical Process Control (SPC) charts of MRI completion time in minutes over weeks were also presented. A run of 6 or more charts on either side of the mean on the SPC chart (a “shift”) is considered a non-random variation because of changes introduced into the process.
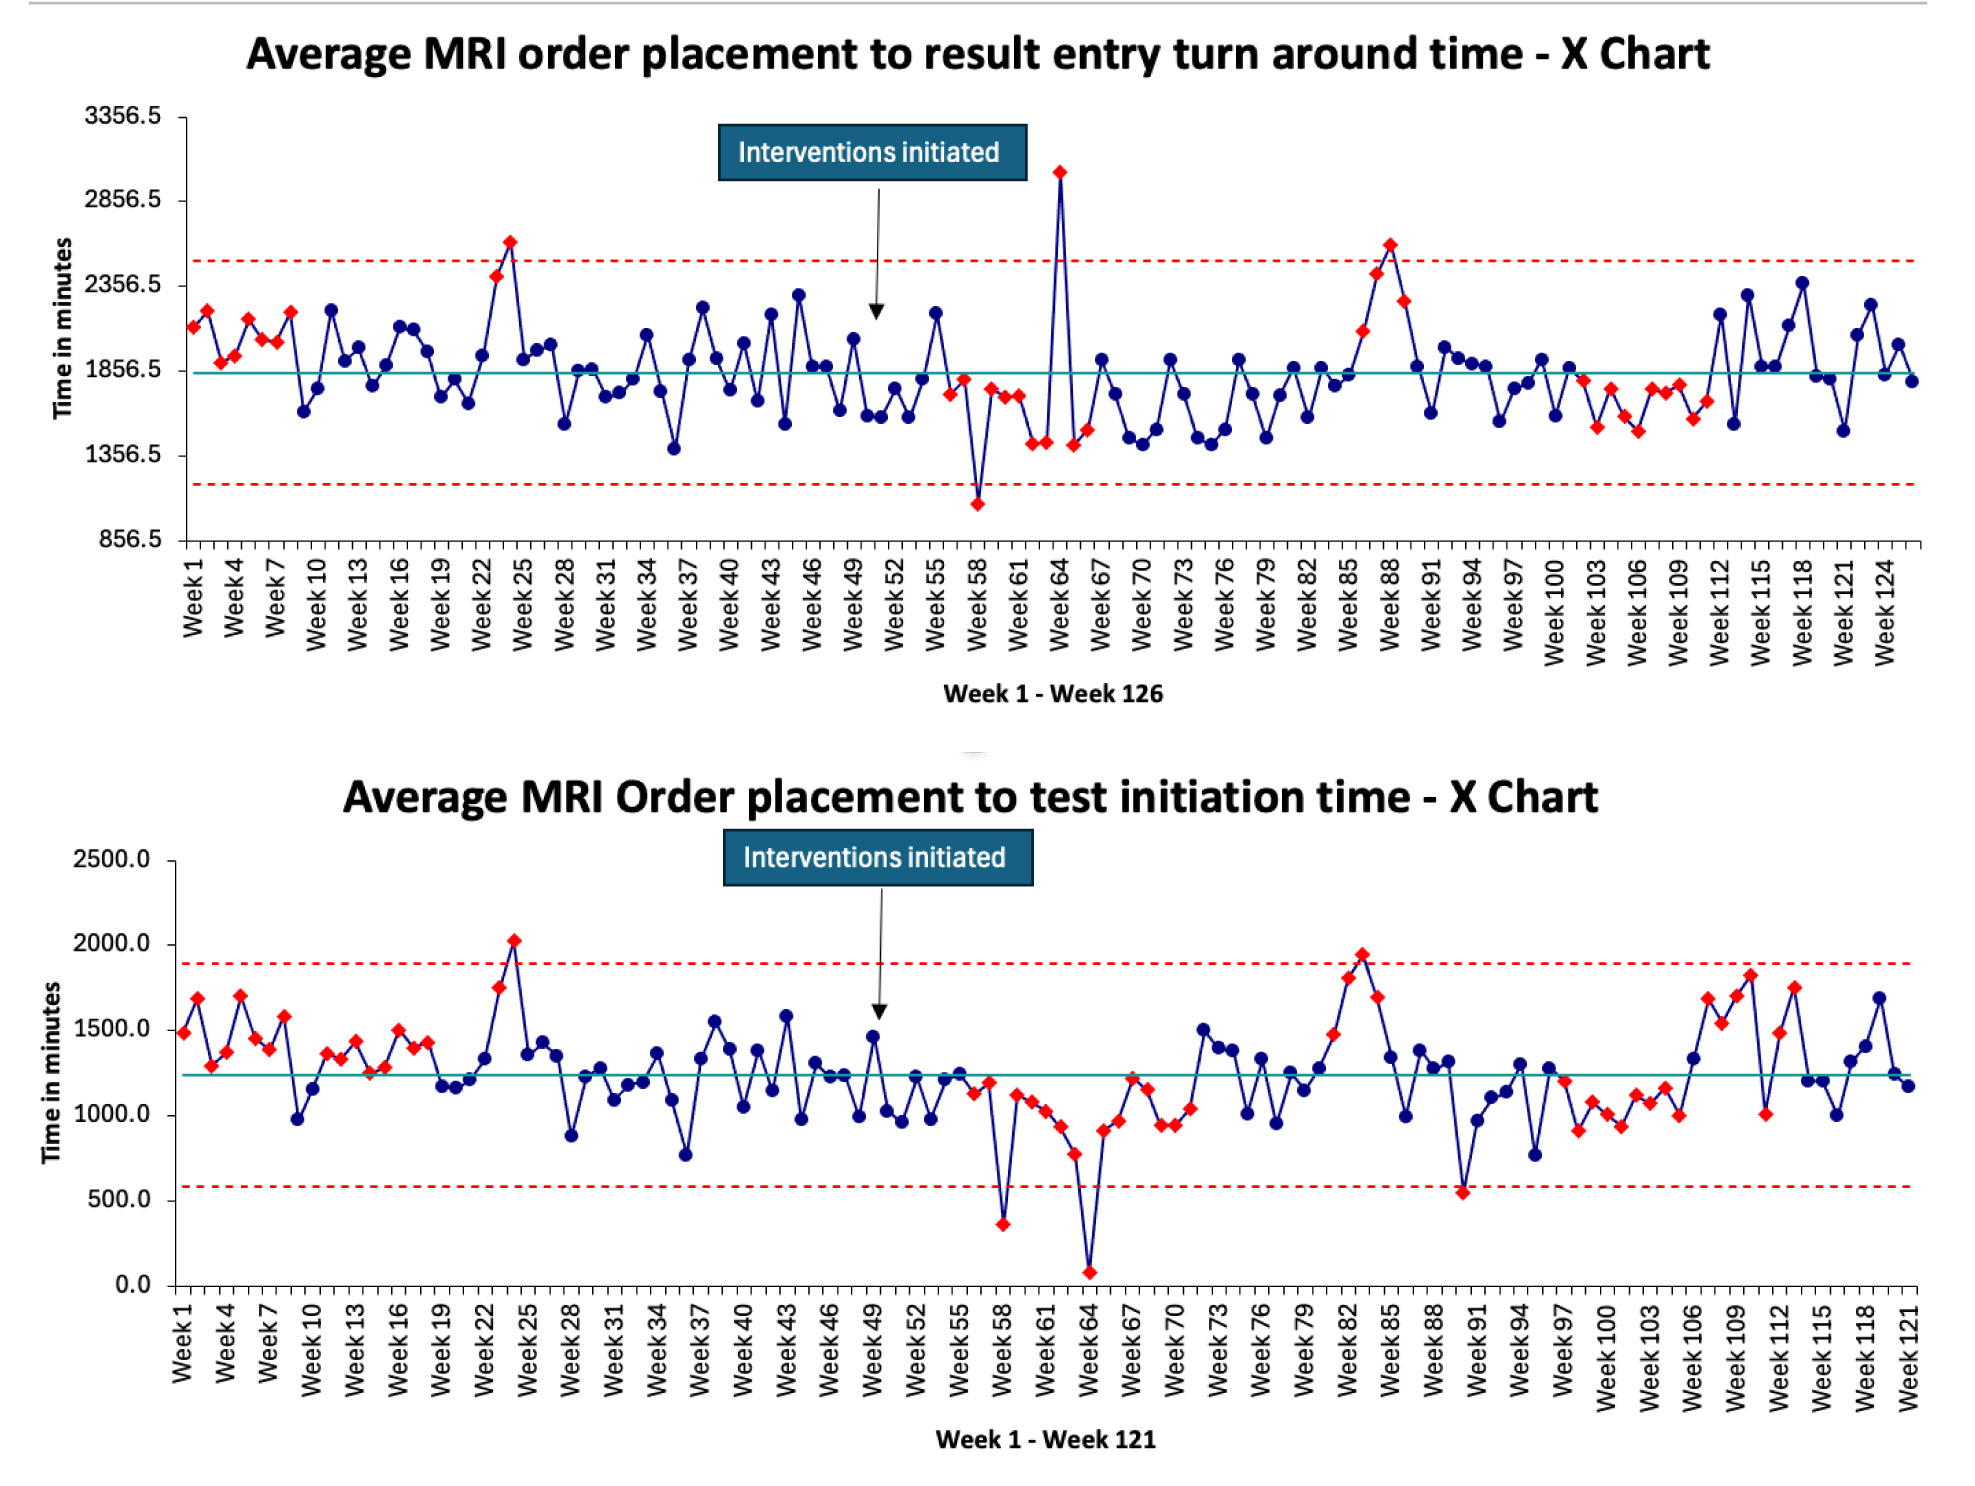
Results: A total of 9278 MRI studies were performed in the baseline period (February 1, 2022 to January 23, 2023; 356 days) and 9598 after the intervention (January 24 to December 31, 2023; 341 days). The average TAT decreased from 1933 minutes/study during the baseline period to 1793 minutes/study after the intervention (p-value: 0.0071). The time between order entry to exam started decreased from 1318 minutes/study to 1183 minutes/study (p-value: 0.011), while the time between exam started to exam ended decreased from 70.4 minutes/study to 66.6 minutes/study (p-value: 0.010). The number of MRI studies performed increased from 149.6 MRIs/week to 162.6 MRIs/week before and after the intervention, respectively (p-value: 0.20). Control charts are presented in Fig. 2.
Conclusions: A multidisciplinary process improvement project guided by lean principles resulted in a statistically significant improvement in the TAT for MRI studies at our institution. This improvement was seen in spite of an increase in the number of MRI studies completed between baseline and intervention periods. Improvement in TAT was primarily driven by a reduction in time between order entry and test initiation. Changes introduced as part of our process improvement project have been hardwired into our hospital’s operations.