Background: Until the advent of novel oral anticoagulants (NOACs), Warfarin was the only oral agent available for the treatment of deep venous thrombosis (DVT) and Pulmonary embolism (PE). Bridging with parenteral anticoagulation until warfarin reaches a full therapeutic level often results in prolonged hospitalization. Rivaroxaban, Dabigatran, Apixaban, Edoxaban were approved by the FDA for DVT & PE treatment in the years 2012, 2014, 2014 and 2015, respectively. In light of this development in the field, we sought to study the temporal trends in DVT and PE hospitalizations and resource utilization over the years 2010-2015.
Methods: We performed a retrospective cohort analysis using the National Inpatient Sample (NIS) for the years 2010-2015. NIS is the largest publicly available all-payer inpatient database in the United States. Inclusion criteria were a primary diagnosis of DVT or PE. Exclusion criteria were saddle and septic PE, age less than 18 or more than 80 years, end-stage renal disease, pregnancy, intracranial hemorrhage, cancer, and primary hypercoagulable state. Diagnoses were identified using appropriate ICD-9-CM codes. The primary outcome was the yearly number of admissions for DVT/PE. Secondary outcomes were yearly in-hospital mortality rate, length of stay (LOS) and total hospitalization costs (TOTCHG). Conditional marginal effects were used to calculate adjusted yearly mortality rates, LOS and TOTCHG. TOTCHG were adjusted for inflation using the consumer price index and presented in 2014 dollars. The year 2012 was used as the reference for trend comparisons over time. Multivariate logistic and linear regression models were used to calculate adjusted odds ratios, mean differences and trend p values for binary and continuous outcomes, respectively. The following confounders were adjusted for: age, sex, race, insurance, median household income in the patient’s zip code, Charlson co-morbidity index (CCI), hospital location, teaching status, and hospital bed size.
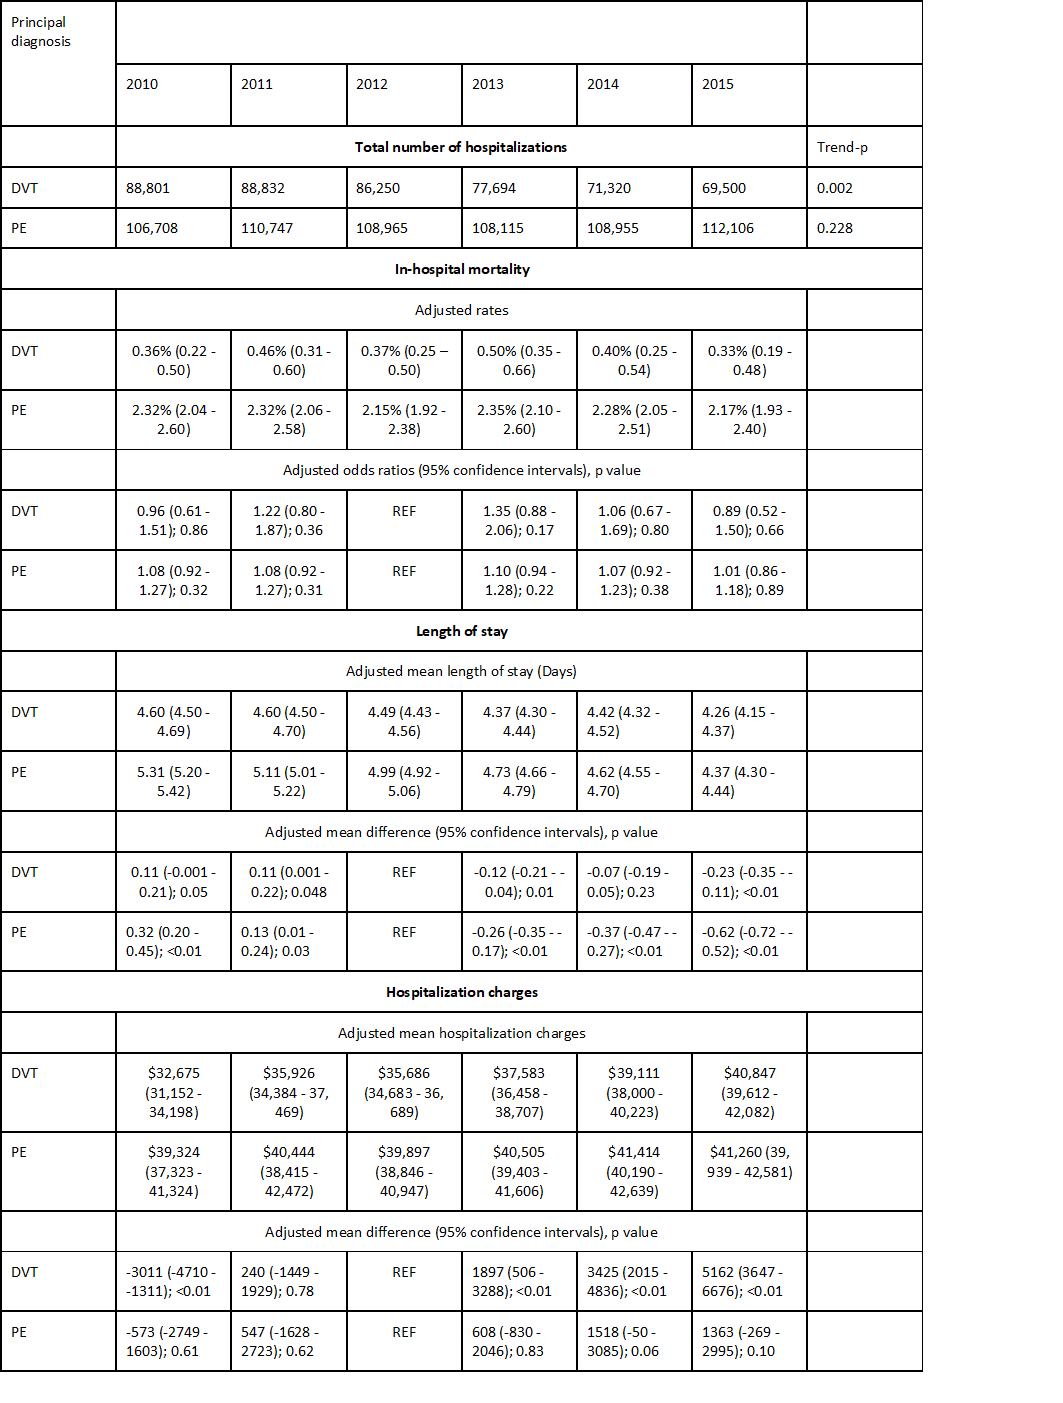
Results: The number of admissions for DVT decreased from 88,801 in 2010 to 69,500 in 2015 (trend p<0.01). There was no linear trend in PE prevalence, with yearly numbers fluctuating from 106,708 in 2010 to 112,106 in 2015 (trend P=0.23)The adjusted mean differences, odds ratios and rates for all outcomes are presented in table 1. For admissions with DVTs, the adjusted mortality rate remained constant over time. However, the adjusted LOS decreased significantly from 2010 to 2015 with a paradoxical increase in adjusted TOTCHG over the same time period. Similar results were obtained for admission with PEs, the adjusted mortality rate also remained constant from 2010 to 2015 and the adjusted LOS significantly decreased over time. However, there was no significant difference in adjusted TOTCHG from 2010 to 2015.
Conclusions: From 2010 to 2015, the number of hospitalizations with DVT decreased but those for PE remained constant. Over the same time period, the in-hospital mortality rate was also for both DVT and PE. However, although LOS shortened for both DVT and PE from 2010 to 2015, the TOTCHG actually increased for DVT and remained constant for PE over time. We hypothesize that the reduction in the number of DVT admissions and LOS of PE admissions is likely a result of increased utilization of NOACs over the years. Lack of a favorable impact on TOTCHG might be multifactorial and includes the much higher NOACs price compared with warfarin and overall increases in healthcare costs over time.