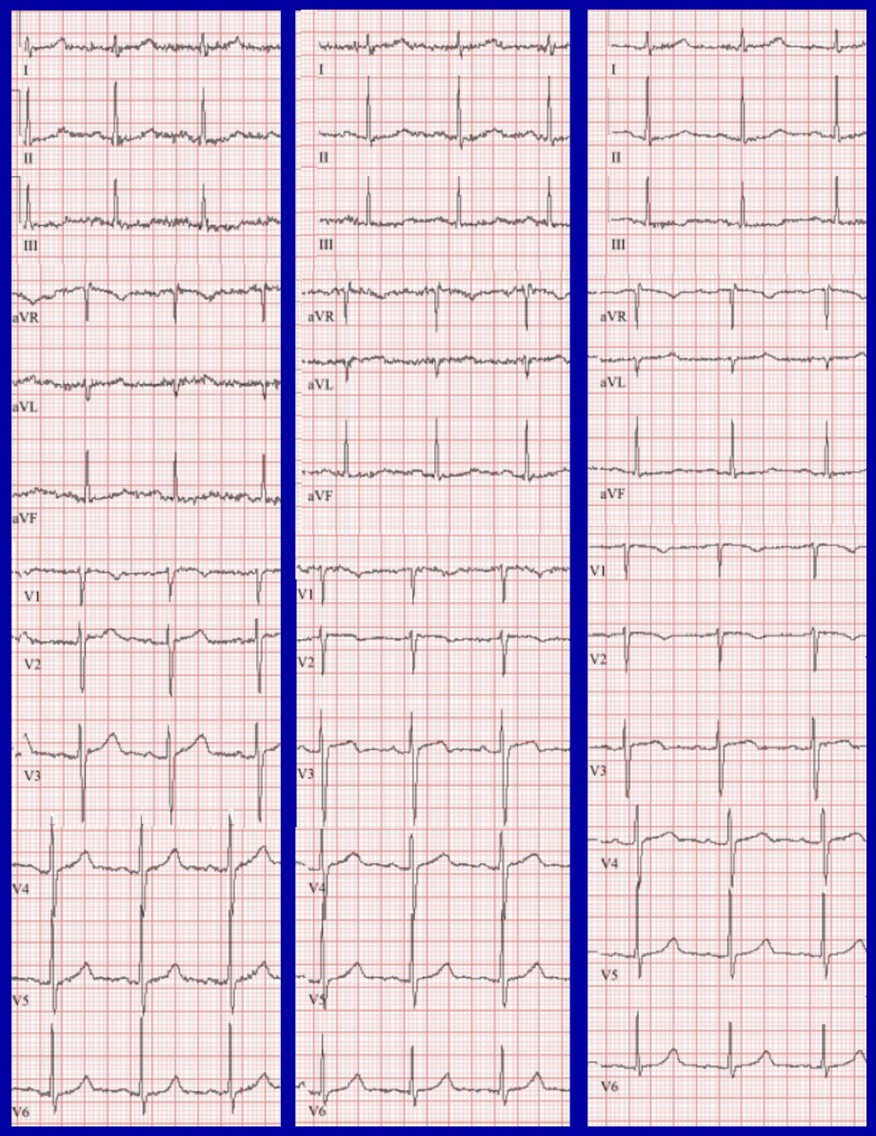
Case Presentation: An 81-year-old patient with hypertension presented to the emergency department with one week of dry cough and fatigue. He reported pleuritic chest discomfort, but denied dyspnea, fevers, chills, palpitations, or lightheadedness. His vital signs were normal. Initial workup was notable for an unremarkable chest x-ray, positive COVID-19 PCR, B-type natriuretic peptide (BNP) 426 pg/mL, and troponin elevation to 0.97 ng/mL. Repeat troponin at 4 hours was 0.70 ng/mL. Serial electrocardiograms (ECGs) over 6 hours demonstrated dynamic T-wave changes in leads III and V2-3 (Figure 1). A CT angiogram was obtained given pleuritic chest discomfort. It showed bilateral pulmonary emboli (PE) with large thrombus burden and signs of elevated right-heart pressures. Subsequent echo also suggested elevated right ventricular pressures. Anticoagulation was started. Mechanical thrombectomy was undertaken given the large thrombus burden, heart strain, and elevated risk scores (BOVA 4, sPESI 2).
Discussion: We present a case of a healthy older individual with cough and pleuritic chest discomfort who was found to have COVID-19, troponinemia, dynamic ECG changes, and ultimately large bilateral PEs. While he was diagnosed with COVID-19 which is known to increase hypercoagulability, he did not have any other typical risk factors for PE. In the absence of hypoxia, tachypnea, dyspnea, and sinus tachycardia, the only initial indicators for PE were his elevated cardiac biomarkers and ECG findings of dynamic T wave changes in anterior and inferior leads. PE is strongly associated with the presence of inverted T-waves in leads III and V1-2, with a maximum magnitude T inversion in leads V1-2. The combination of these two findings identify PE with 98% sensitivity and 92% specificity (1).These changes were present in our patient, most evident at t+6h (Figure 1). When these changes are seen, PE should be considered on the differential even if there is low clinical suspicion for PE. In a retrospective analysis of patients newly diagnosed with PE and with prior ECGs for comparison, 75% of patients were found to have noticeable changes in their ECGs. T-wave inversions and flattening were the two most common changes (34% and 30%, respectively). Less than one in twenty patients had the classically described S1Q3T3 pattern (2). Other variable ECG findings associated with acute PE included sinus tachycardia, right axis shift, p-pulmonale pattern, right bundle branch block, and ST elevation or depression. However, none of these findings are specific.
Conclusions: In the U.S., PE is the 2nd most commonly missed or delayed diagnosis in hospitalized patients (3). Our case reminds us that the ECG and cardiac biomarkers can play a pivotal role during the evaluation of PE, particularly in patients with minimal symptoms and increased risk factors for PE.