Background: Chronic Obstructive Pulmonary Disease (COPD) is a lung disease characterized by chronic, irreversible airway obstruction that can precipitate into acute exacerbations (AECOPD) of cough, dyspnea and sputum production, often requiring hospitalization. Hospital systems aiming to improve outcomes for patients with AECOPD are testing innovative approaches to care in the acute care setting. To enroll patients in these types of interventions requires a method for real-time identification of hospitalized patients with AECOPD. A data-driven approach allows for more efficient deployment of such population health resources. This study aims to measure and compare the effectiveness of several models designed to identify patients with AECOPD within 24 hours of admission using administrative and clinical data.
Methods: Using chart review, we empirically identified clinical factors associated with patient admissions for AECOPD. Clinical and billing variables that are available in the first 24 hours of an encounter were combined into six different models and then tested retrospectively to predict if an admitted patient had AECOPD. This dataset was created using billing and clinical data from patients who were older than 40 years of age with inpatient or observation admission encounters in nine Carolina HealthCare System facilities throughout 2016 (n=116,329). Model performance was compared to ICD10 billing code (J44.1) for AECOPD associated with the same index encounters calculating the sensitivity, specificity, positive predictive value (PPV) and negative predictive value (NPV).
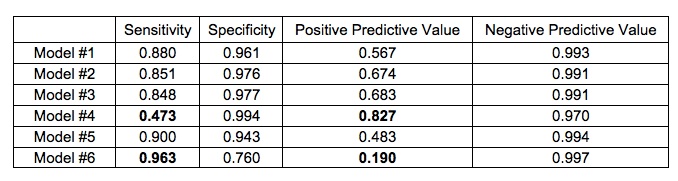
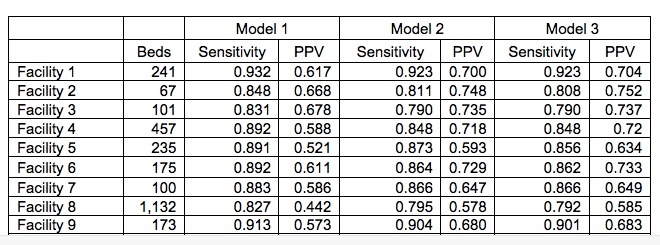
Results: Of the 116,329, encounters 6,383 were associated with AECOPD. The model performance results are summarized in Table 1. Model #4 and Model #6 showed the wide range of sensitivity (0.473 for Model #4 versus 0.963 for Model # 6) and positive predictive value (0.190 for Model #6 versus 0.827 for Model #4). The addition of a dosage criterion of greater or equal to 40 mg for steroid administration contributed to an absolute increase in PPV of 10.7% (Model #2) and 11.6% (Model #3) in comparison to Model #1, which did not include a dosage criteria. Consequently, Models #2 and 3 also experienced a decrease in sensitivity of 2.9% and 3.2% in comparison to Model #1. Table 2 shows the performance of Models # 1-3 by facility.
Conclusions: This study demonstrates that it is possible to leverage clinical and administrative data to identify patients admitted with AECOPD in real-time for research or quality improvement purposes. The variation between models and facilities emphasizes the importance of choosing an appropriate model to align with the goals of the initiative, as well as testing models in each unique setting or population. Future research will be required to prospectively evaluate the models presented here.