Background:
Since the 1999 IOM report To Err is Humanhighlighted that up to 98,000 preventable deaths occur annually in U.S. hospitals, efforts have intensified to understand and eliminate preventable mortality. At our institution, we developed an in-person, near real-time, multidisciplinary mortality review to capture the insight of frontline providers and improve care. In the analysis presented here, we compare the characteristics of deaths deemed potentially preventable and non-preventable.
Methods:
Over three years, we held over 300 mortality review meetings. As part of the standardized review, the physician and nursing team assesses whether the death was potentially preventable. Deaths were stratified according to this assessment, and continuous variables were evaluated using two sample t-tests and categorical variables with chi-squared or Fisher’s exact tests as appropriate.
Results:
Of 331 cases reviewed, 22 were deemed potentially preventable (6.7%) and 309 non-preventable (93.3%). Deaths deemed potentially preventable had shorter lengths of stay (mean 6.7 vs. 20.1 days, p=0.04) and were more likely to occur in an ICU setting (63.6% vs. 51.8%, p=0.02). Age and source of admission did not differ significantly.
Cases deemed potentially preventable were more likely to be classified as unexpected deaths (47.6% vs. 7.5%, P<0.001). Cases were more likely to be DNR/DNI or comfort care at the time of death (P<0.001 for both), but use of palliative care services and code status at admission did not differ. Code blues were more common in deaths deemed potentially preventable (63.6% vs. 16.5%, p<0.001), and reviewers were more likely to deem the code preventable (35.7% vs. 6.5%, P=0.01).
Statistically significant differences in the primary reasons for mortality were seen in deaths deemed potentially preventable versus not preventable (p<0.001). There were more deaths due to acute medical complications, medication adverse events and surgical/procedural complications in the deaths deemed potentially preventable, and more chronic medical conditions and harm occurring before hospitalization in the non-preventable deaths.
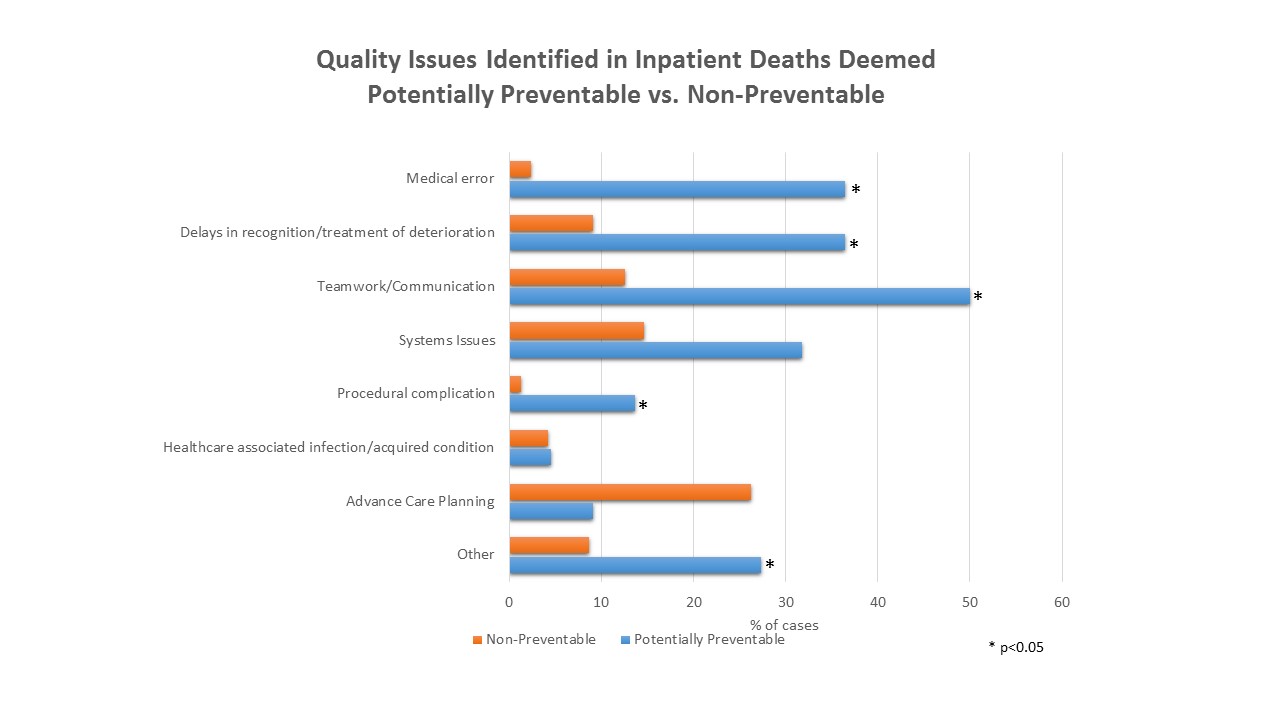
Opportunities for improvement in care were identified in more of the cases deemed potentially preventable (100% vs 45.3%, P<0.001). Specifically, medical errors (36.4% vs. 2.3% of cases, P<0.001), delays in recognition or treatment of deterioration (36.4% vs. 9.1%, P<0.001), communication/teamwork issues (50% vs. 12.6%, P<0.001) and procedural complications (13.6% vs. 1.3%, P=0.008) were all noted more frequently in deaths deemed potentially preventable. There were no significant differences in systems issues, healthcare-acquired infections/healthcare-associated conditions, or problems with advance care planning. Cases deemed potentially preventable were more likely to inspire quality improvement action items (81.8% vs. 26%, P<0.001).
Conclusions:
While providers deem a small fraction of inpatient deaths potentially preventable (6.7%), there are significant differences in these cases compared to deaths deemed non-preventable. Many are related to patient risk of mortality, goals of care, and expectedness of death. However, significant differences were also noted in patient care, including medical errors, delays, teamwork and procedural complications. Additionally, significantly more actionable quality opportunities were identified, suggesting that inpatient mortality rates can be further reduced by improving care.