Background: Patient experience is an important outcome for hospitals. These outcomes impact insurer payments, hospital ratings, and perceived quality of care (1). Like many hospitals, our patient experience is measured using Hospital Consumer Assessment of Healthcare Providers and Systems (HCAHPS) surveys administered by Press Ganey (PG). Response rates to PG surveys are low, especially from general medicine and hospitalist patients (2). As such, it is unclear whether PG surveys adequately capture the experience of the population we treat. For over 25 years, our section of Hospital Medicine has also captured patient experience data with the Hospitalist Project (HP) survey (3). Unlike PG surveys which are conducted mostly through US mail with limited follow-up, HP surveys are conducted via phone with significant effort to reach patients. This study aims to explore the value of HP data to understand how respondents to these surveys differ, predictors of survey response, and potential impact of PG non-response on our perception of patient experience.
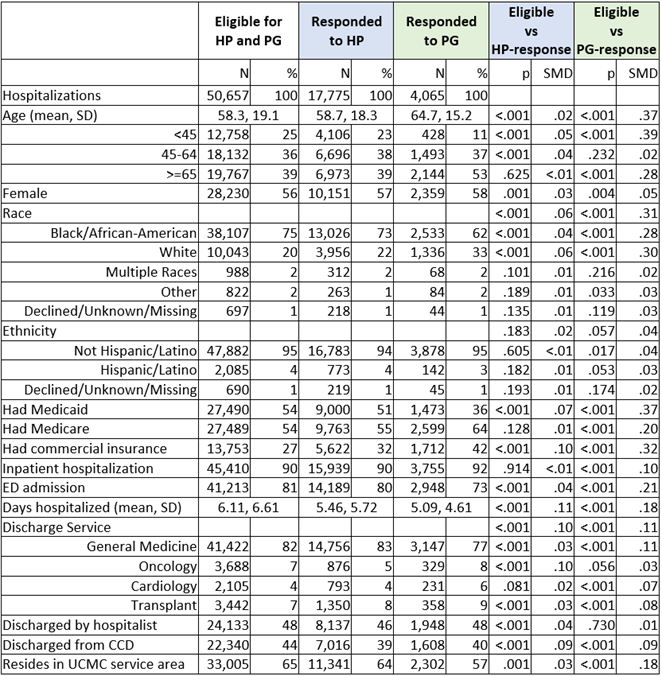
Methods: For all general medicine and hospitalist hospitalizations eligible for PG surveys between 2013 and 2019, we compared basic demographics of the eligible population, HP respondents, and PG respondents. We then compared overall hospital ratings across the subgroups.
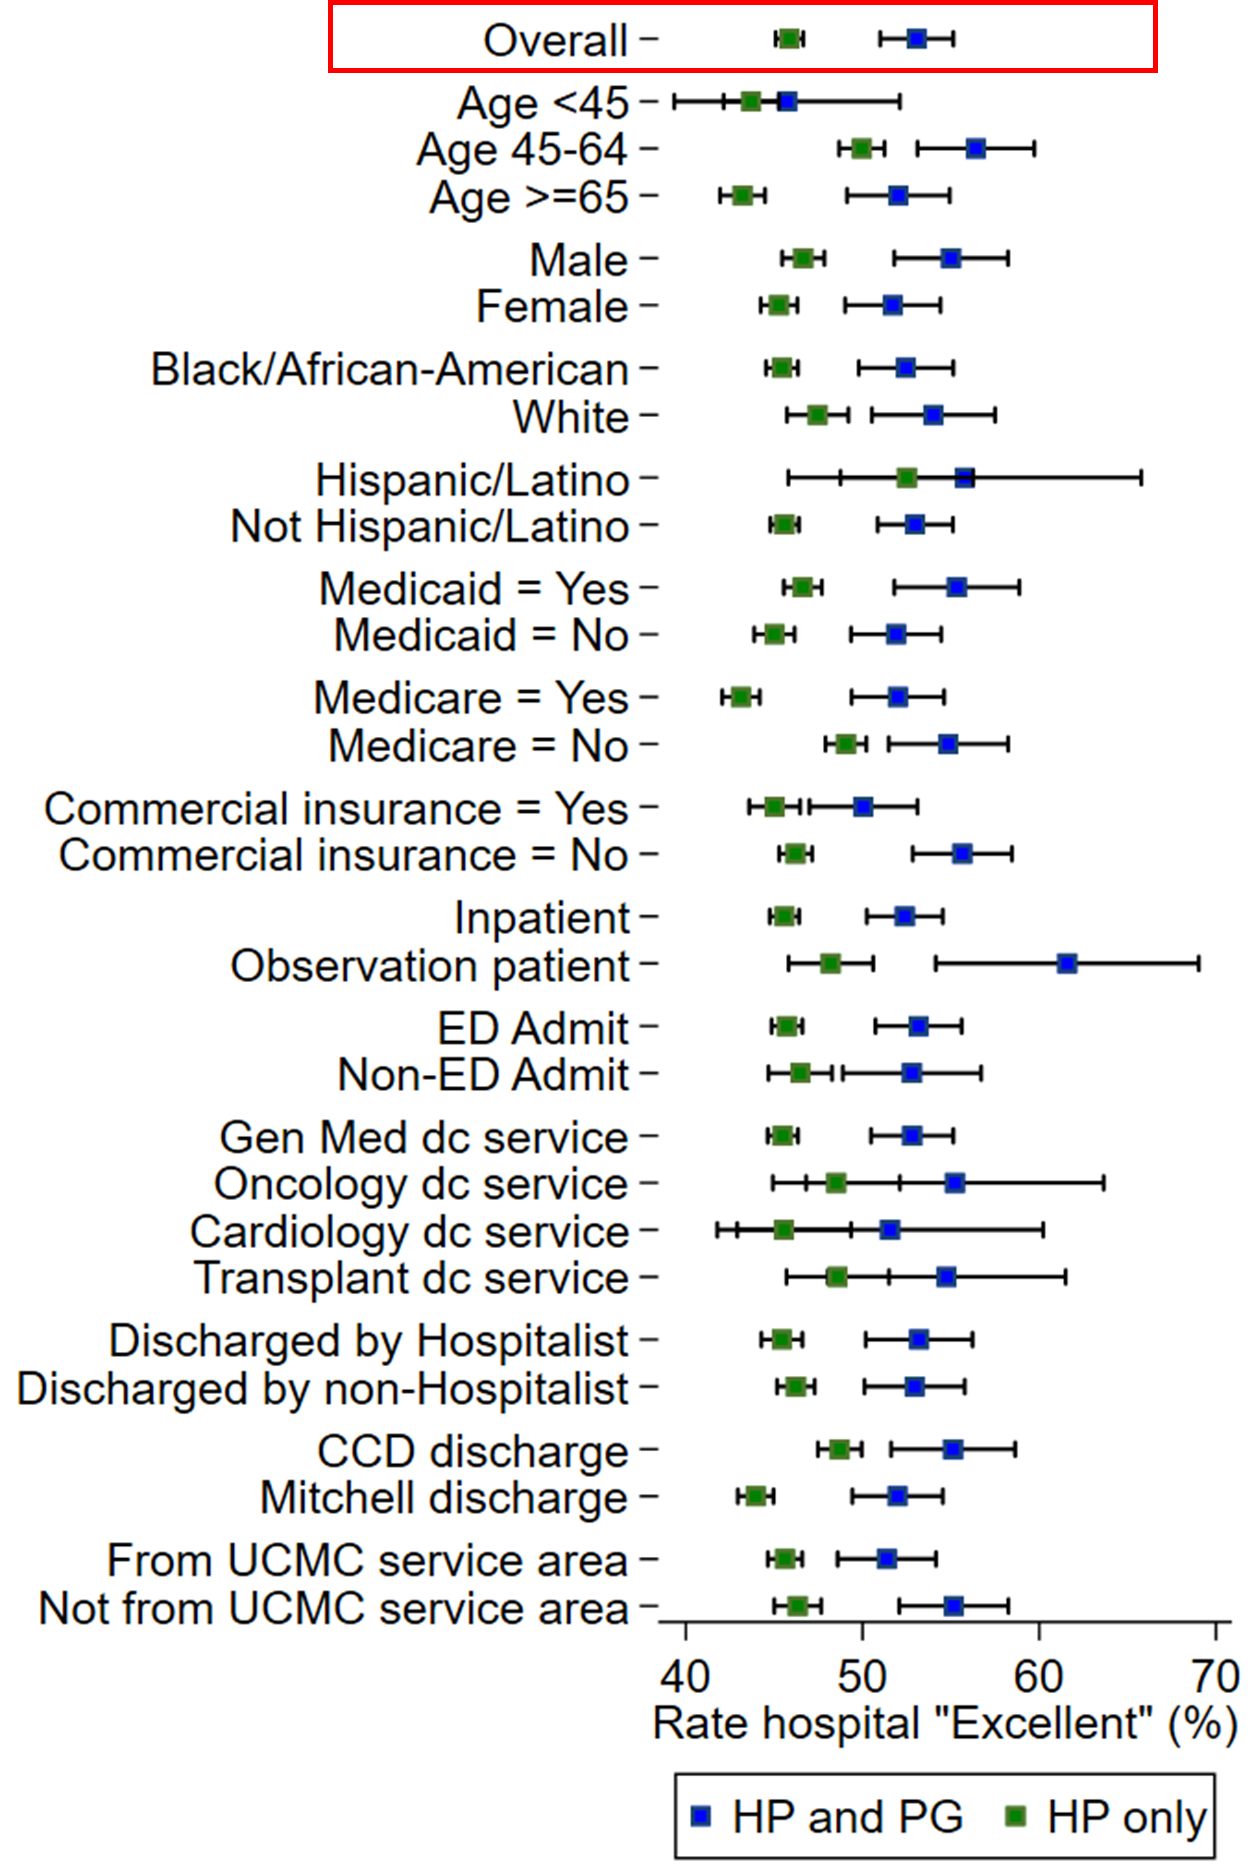
Results: Of the 50,657 general medicine and hospitalist hospitalizations eligible for PG surveys between 2013 and 2019, 4,065 (8%) responded to the PG survey and 17,775 (35%) responded to the HP survey. Respondents to each survey differed from the survey-eligible population (Table 1). Compared to the survey-eligible population, respondents to each survey were more likely to be age 45 or older, White, insured by commercial insurance, not insured by Medicaid, and discharged with a shorter length of stay. HP respondents resembled the population more closely than PG respondents. We then compared overall hospital ratings by respondent group (Figure 1). We found that HP-only respondents were less likely to rate the hospital as “Excellent” than respondents to both the HP and PG survey. These differences were not explained by demographics alone; a multivariable logit model for an outcome of “Excellent” and the covariates in Figure 1 resulted in an OR of 1.35 (95% CI: 1.23, 1.49; p< 0.001) for patients who responded to both the HP and PG surveys. To explore a potential etiology of the difference between PG and HP respondents, we then stratified those who responded to the HP survey by number of follow-up calls needed to elicit response. We found that those who required 4+ follow-up calls were more likely to report worse experiences than those who required 2-3 calls or those who only required 1 call (Excellent rating 45.1%, 47.9%, 51.0% respectively, p< 0.001).
Conclusions: The HP survey reached a larger proportion of general medicine and hospitalist discharges than the PG survey. Differences in response across HP and PG-respondent populations cannot be explained by demographic factors alone suggesting limitations to the phone and mail approach used by our PG surveys. Ease of reaching a patient may help explain this difference with more difficult to reach patients reporting poorer hospital experiences. Further efforts are needed to understand and improve the experiences of patients not currently represented with standard HCAHPS methodologies.