Background: For hospitalist sections that cover a variety of inpatient services from general medicine to oncology, geographic cohorting of patients may be difficult to execute and maintain. The varying influx of admissions and discharges can result in mismatches in available beds and services. Successful implementation of geographic assignment may require considerable costs including institutional support, additional staff, and close monitoring by medical directors [1], as well as physician labor for patient distribution task. However, there may be cost-effective measures to augment patient distribution by utilizing technology to perform this algorithm-based process.
Purpose: The hospitalist section at our academic medical center runs 13 direct care rounding teams (J, K, L, M, NPA, O, P, Q, R, S, T, U, W), at capacities ranging from 12-16 patients per team and often operates above total capacity of 162 patients. Providers also staff services (“Bridge”, “LG”, “Night”) that admit new patients, who are then placed on an overnight list and distributed to rounding teams daily. This non-clinical, labor-intensive task is carried out by the Night Triage hospitalist. We sought to develop an algorithm-driven patient distribution tool to augment geographic co-location of patients, by reducing inconsistencies in patient assignments and improving compliance with co-location rules, and reduce physician time on the task.
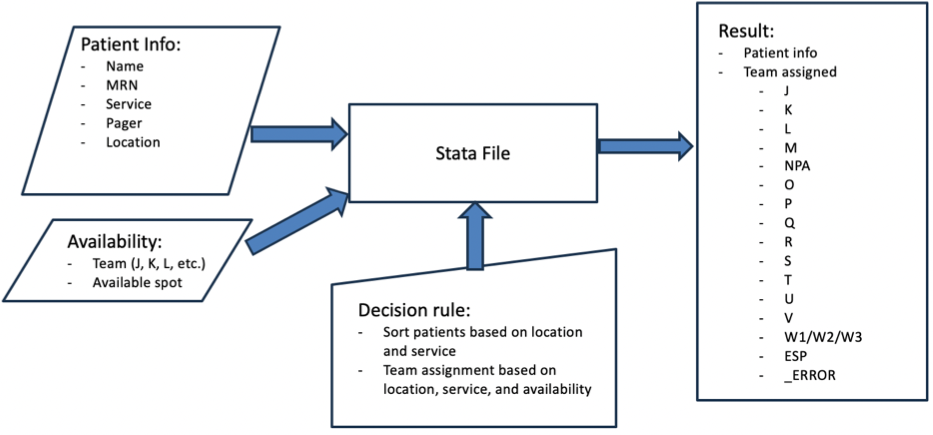
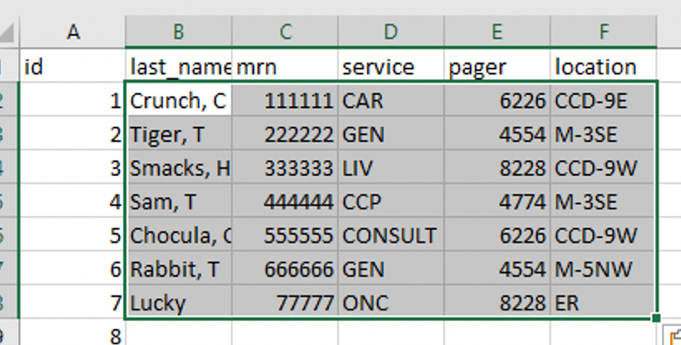
Description: We used a tiered approach, influenced by a prior stimulation study assessing patient assignment models [2]. Patients were mapped to primary, secondary, and tertiary teams based on their admitting service, assigned unit, and team capacity, and iteratively changed to match the rollout of a hospital-wide co-location initiative. The algorithm was built in Stata Software using specified decision rules that scans patients; calculates a priority score based on assigned unit, pavilion, and admitting service; sorts patients by priority score; and puts them in queue for team assignment. The program then checks for primary, secondary, and tertiary team availability, assigning by service, location, then capacity (Figure 1). Team capacity and patient information (i.e. name, unit, service) are inputted manually in Excel files read by Stata. Results are outputted in an Excel file (Figure 2). The distribution tool was launched in August 2023 for optional use by hospitalists on the Night Triage service. Self-reported times for manual distribution of patients pre-roll out were 30-180 minutes. Tested run times for distribution of patients with the distribution tool, including assessing team capacities and patient information was less than 20 minutes. Adoption has been slow, with only 8 of 17 hospitalists who have worked the night triage shift using the tool. This may be due to the perceived steep activation energy in learning a new process and the cumbersome access process in which users must log into a remote environment to access the tool. We have yet to analyze the effectiveness of geographic sorting due to inconsistent use of the tool.
Conclusions: We built a semi-automated distribution tool that sorts patients to various hospitalist teams based on assigned unit, admitting service, and team capacities, reducing time spent on this non-clinical task. Broader adoption was limited due to access barriers to the tool. Next steps include exploring alternative software or integration to the electronic medical record to improve accessibility and minimize manual input and measuring effectiveness of co-location.