Background: Using average length of stay (LOS) as a quality indicator for individual hospitalists is problematic because it is a metric typically attributed to the discharging attending, who may not have cared for the patient for the majority of the hospitalization. In addition, a hospitalist may have a long average LOS if they are skilled at discharging patients who would have otherwise remained hospitalized under the care of other physicians. Discharge density (DD), calculated as the proportion of discharge visits to total visits, may better reflect the skill in discharging patients than LOS. A prior study found that DD correlated with LOS. We sought to determine if DD is correlated with LOS to explore whether the metric has potential to better assess practice patterns. Our hypothesis was that these metrics would not be highly correlated as DD may have the potential to overcome the limitations of LOS as a performance indicator.
Methods: The LOS, adjusted LOS, and the DD were calculated for 32 faculty members on a large academic hospitalist service at a tertiary hospital. Hospitalists care for patients in two-week blocks with optional weekend coverage coverage and then hand off the patient to another group member. LOS was attributed to the discharging hospitalist, regardless of the amount of time this attending cared for the patient. Adjusted LOS was calculated using the observed:expected ratio. The DD was calculated for all weeks the hospitalist had a primary attending role, either on the Teaching Service or Non-Teaching Medicine Service. Other services, such as Co-management, were excluded. Encounters during weekends were excluded to avoid disadvantaging hospitalists who work a greater number of weekends, as patients at our hospital are less likely to be discharged on a weekend than weekday. The Pearson r coefficient was used to determine the strength of correlations.
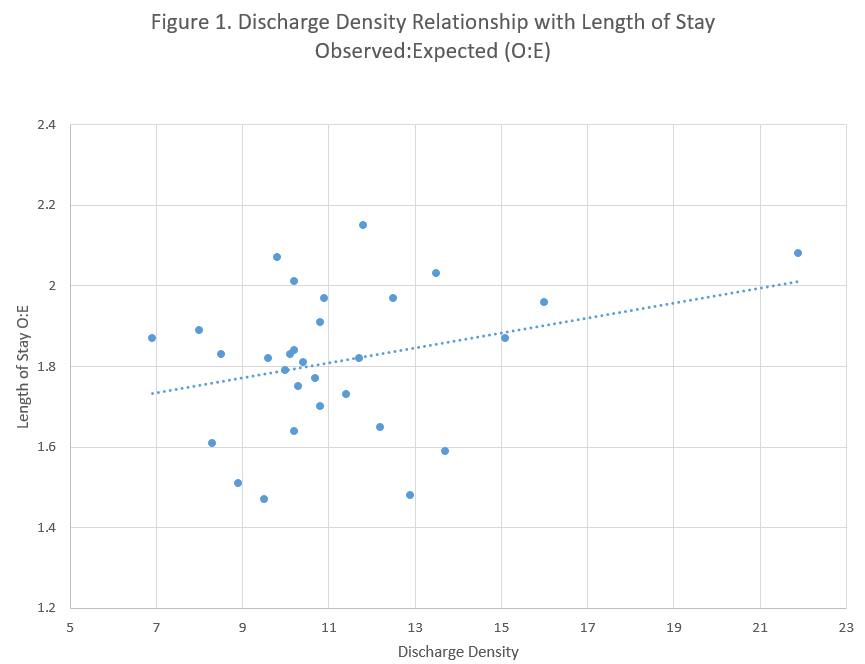
Results: The time on service during the study period November 1, 2021 to October 31, 2022 ranged from 6 to 33 weeks. The group average LOS, inlier LOS, and DD were 9.4 days, 7.4 days, and 10.8%, respectively. The DD ranged from 6.9% to 21.9%. DD was not correlated with LOS (r = -0.04, p=0.85), inlier LOS (r = -0.03, p=0.88), or risk adjusted LOS (r = 0.29, p=0.11). DD was also not correlated with readmission rate (r = -0.20, p=0.28).
Conclusions: We found no statistically significant correlation between the DD and LOS. Average LOS attributable to the discharging hospitalist is fraught with uncertainties when used as a performance indicator for individual hospitalists on a service with frequent handoffs. The lack of correlation of DD with LOS suggests DD may be a fundamentally different indicator. Our initial exploration into whether DD correlates with other key performance metrics using the readmission rate did not find a correlation. Future analyses should compare DD and LOS with other markers of quality to gauge if DD may better assess performance. This important next step will help group leaders determine if they should shift from LOS to DD on performance reviews, dashboards, and quality-based incentives.