Background: Diagnostic errors in hospitalized patients are difficult to identify and quantify: error rates range from 4.8 to 49.8%. Though chart review tools, like the Safer Dx instrument, have been developed to assess the presence of diagnostic error in ambulatory settings, they have yet to be validated for acute care. A key issue is identifying cohorts of cases likely to have diagnostic error. Recent work suggests that certain events captured by the electronic health record (EHR) may serve as potential triggers for detecting cases likely to have diagnostic error for subsequent chart review. The goals of this study are to adapt a chart review tool for the acute care setting; demonstrate the feasibility of a process for confirming the presence of diagnostic error in a cohort of expired patients; and explore the frequency and association of “e-trigger” events in hospitalized patients with and without diagnostic error.
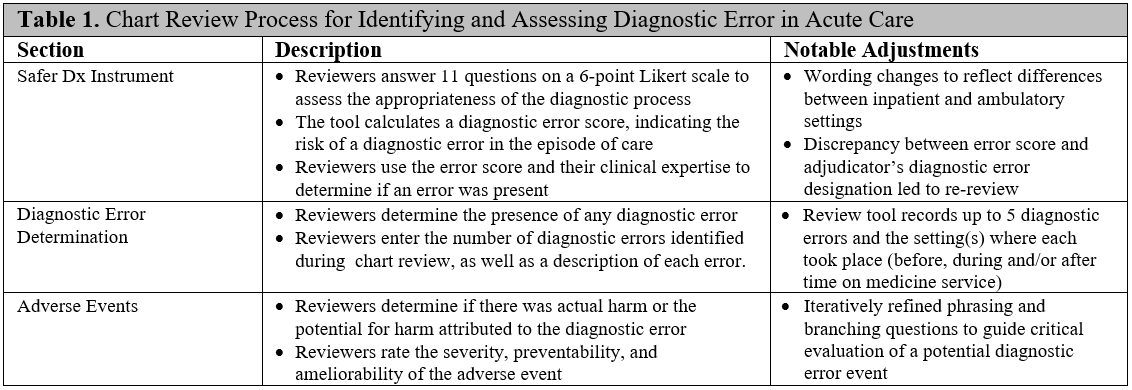
Methods: Our chart review instrument was adapted for acute care based on the Safer Dx instrument and the Naranjo algorithm (Table 1). We designed a structured process that guides clinician reviewers to independently review the EHR; complete the Safer Dx items; and determine the presence and number of diagnostic errors, as well as their preventability, ameliorability, and potential for harm. Next, we identified a cohort of 365 patients who expired in the hospital from 2016 – 2018 and spent at least some of their hospitalization on the medicine service. We randomly selected cases from this cohort for chart review: each case was independently reviewed by two clinician adjudicators and all discrepancies were resolved. We then calculated the frequency of diagnostic error and the number of errors per case. Finally, we compared the rates of e-triggers events in cases with and without diagnostic error using Fisher’s Exact Test.
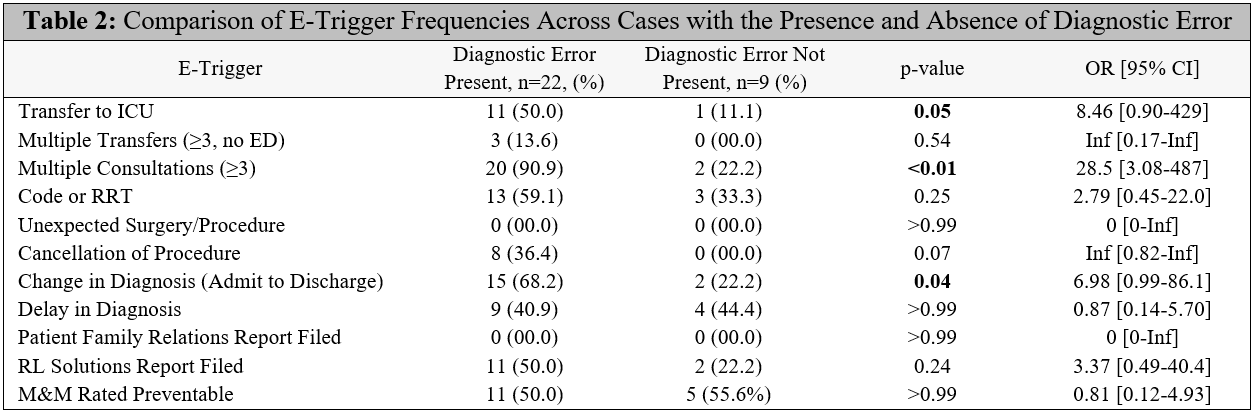
Results: Thirty-one cases were reviewed using our chart review process. The percentage of cases with one or more diagnostic errors was 73.0%. The mean (SD) number of diagnostic errors per confirmed case was 1.7 (0.68). Examples of diagnostic error include failure to consider sepsis as primary diagnosis on admission; failure to recognize worsening infection as hospitalization progressed; failure to consider mesenteric ischemia as potential diagnosis on admission; failure to pursue alternative etiologies of leukocytosis upon admission; and failure to consider an important secondary diagnosis (adrenal insufficiency) in light of an incidental finding. Despite wide confidence intervals, several e-triggers (Table 2) were significantly more prevalent in cases with diagnostic error compared to cases without diagnostic error: multiple consultations (p<0.01), change in diagnosis from admission to discharge (p=0.04), and transfer to ICU (p=0.05).
Conclusions: We developed a structured chart review process to assess diagnostic error for patients who died in the hospital. The rate of confirmed diagnostic error was notably high in this cohort. Several e-triggers were more frequently present in confirmed cases of diagnostic error. Our next steps are to conduct additional chart reviews to confirm these findings and to expand the selection of e-triggers we examine. Once validated, these e-triggers could serve as a useful screen to identify cases likely to have diagnostic error for further chart review, both retrospectively and in real-time. This is a crucial step for outcome assessment in trials of interventions to reduce diagnostic errors.