Background: Since the “birth” of hospitalist in mid-nineties, it took 20 years to grow from zero to 50,000 physicians in 2016. In the U.S, internal medicine (IM) services are covered by different models, including teaching IM services and non-teaching services. Non-teaching services are attended by hospitalists or outpatient-practicing internists.
Methods: We conducted a classical prospective cohort study. Consecutive patients were recruited dynamically between 2/25/2019 -4/30/2019. Patients included were ≥18 years admitted to IM services for any reason. Excluded patients who did not consent. We collected the following data: age, sex, ethnicity, assistance at home, food security most the year, residence prior to admission, type of insurance, admission diagnosis (16 categories) and comorbidities (17 categories). In-hospital mortality, 30-day all-cause readmission, and 30-day mortality were outcomes of interest. Propensity score by inverse probability of treatment weighting. Subsequently, we fitted weighted multiple logistic regression for in-hospital mortality and weighted multiple cox proportional hazard for readmission and 30-day mortality to compare teaching and nonteaching services. The causal estimand was the average treatment effect. Baseline characteristics were compared using parametric and non-parametric analysis. Diagnostics were used to assess propensity score model and multiple regression models.
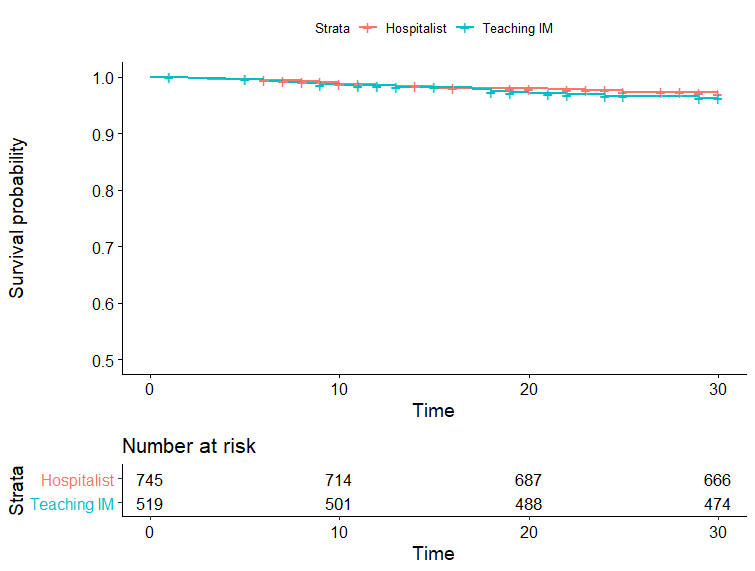
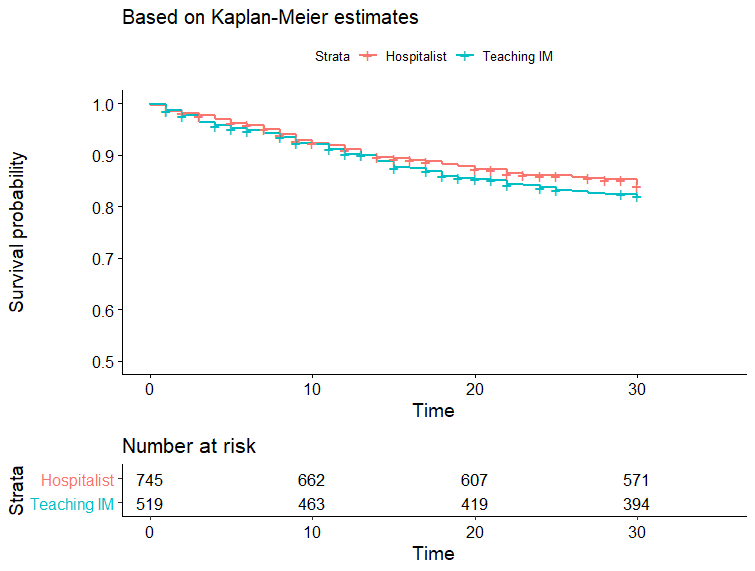
Results: A total of 1273 patients were admitted in the study period. The mean age was 61 ± 19 years and females were 52%. Teaching IM admitted 526 patients and Non-teaching admitted 747 patients. Baseline characteristics were well balanced with standardized biases less <0.1 post propensity matching. On unadjusted logistic regression, teaching IM had 5 times increased odds of inpatient mortality in comparison to non-teaching services (P=0.045). However, weighted adjusted regression model showed no difference in inpatient mortality (ORR: 1.03, p-value= 0.94). There was no difference in 30-day readmission or 30-day mortality on log-rank analysis (p-value= 0.3, p-value= 0.6). Figures 1 and 2 demonstrate Kaplan Meier curves. No difference was seen in readmission (HR=0.96, p-value=0.8) or mortality (HR=1.2, p-value=0.5) on multiple cox hazard regression.
Conclusions: There was no difference in in-hospital mortality, 30-day readmission or 30-day mortality between teaching IM and hospitalists.