Background: In 2022, healthcare spending in the US accounted for 17.3% of its GDP(1), yet the US ranked near the bottom among high-income nations for key health outcomes. It is unclear if a similar relationship exists between spending and health outcomes across US Hospitals. Centers for Medicare and Medicaid Services (CMS) reports a standardized risk-adjusted spending measure (Medicare spending per beneficiary [MSPB]) and several risk-standardized hospitalization outcome measures allowing for comparisons across hospitals(2-5). Therefore, we examined the relationship between risk-standardized hospitalization outcomes (30-day readmissions and mortality after heart failure [HF], acute myocardial infarction [AMI], and pneumonia) and MSPB.
Methods: We obtained data from three sources: 1) MSPB, hospital characteristics, and risk-standardized 30-day readmission and mortality rate data from 2014-2022 obtained through CMS, 2) regional demographic and economic data from the US Census Bureau, and 3) Zip code mapping to hospital catchment area data from the Dartmouth Atlas of Healthcare. We excluded hospitals that did not report data on MSPB and readmissions or mortality. Data were summarized using mean (SD) or percentages, and differences were analyzed with the Chi-square or Wilcoxon rank-sum tests. We examined the relationship between hospitalization outcomes and MSPB using univariable and multivariable linear regression models accounting for correlation between observations from the same hospitals. Multivariable models were adjusted for reporting time-period, hospital ownership, teaching status, number of beds and nurses, rural/urban location, and catchment area demographics (total population, median income, poverty, African American, and insurance percentages).
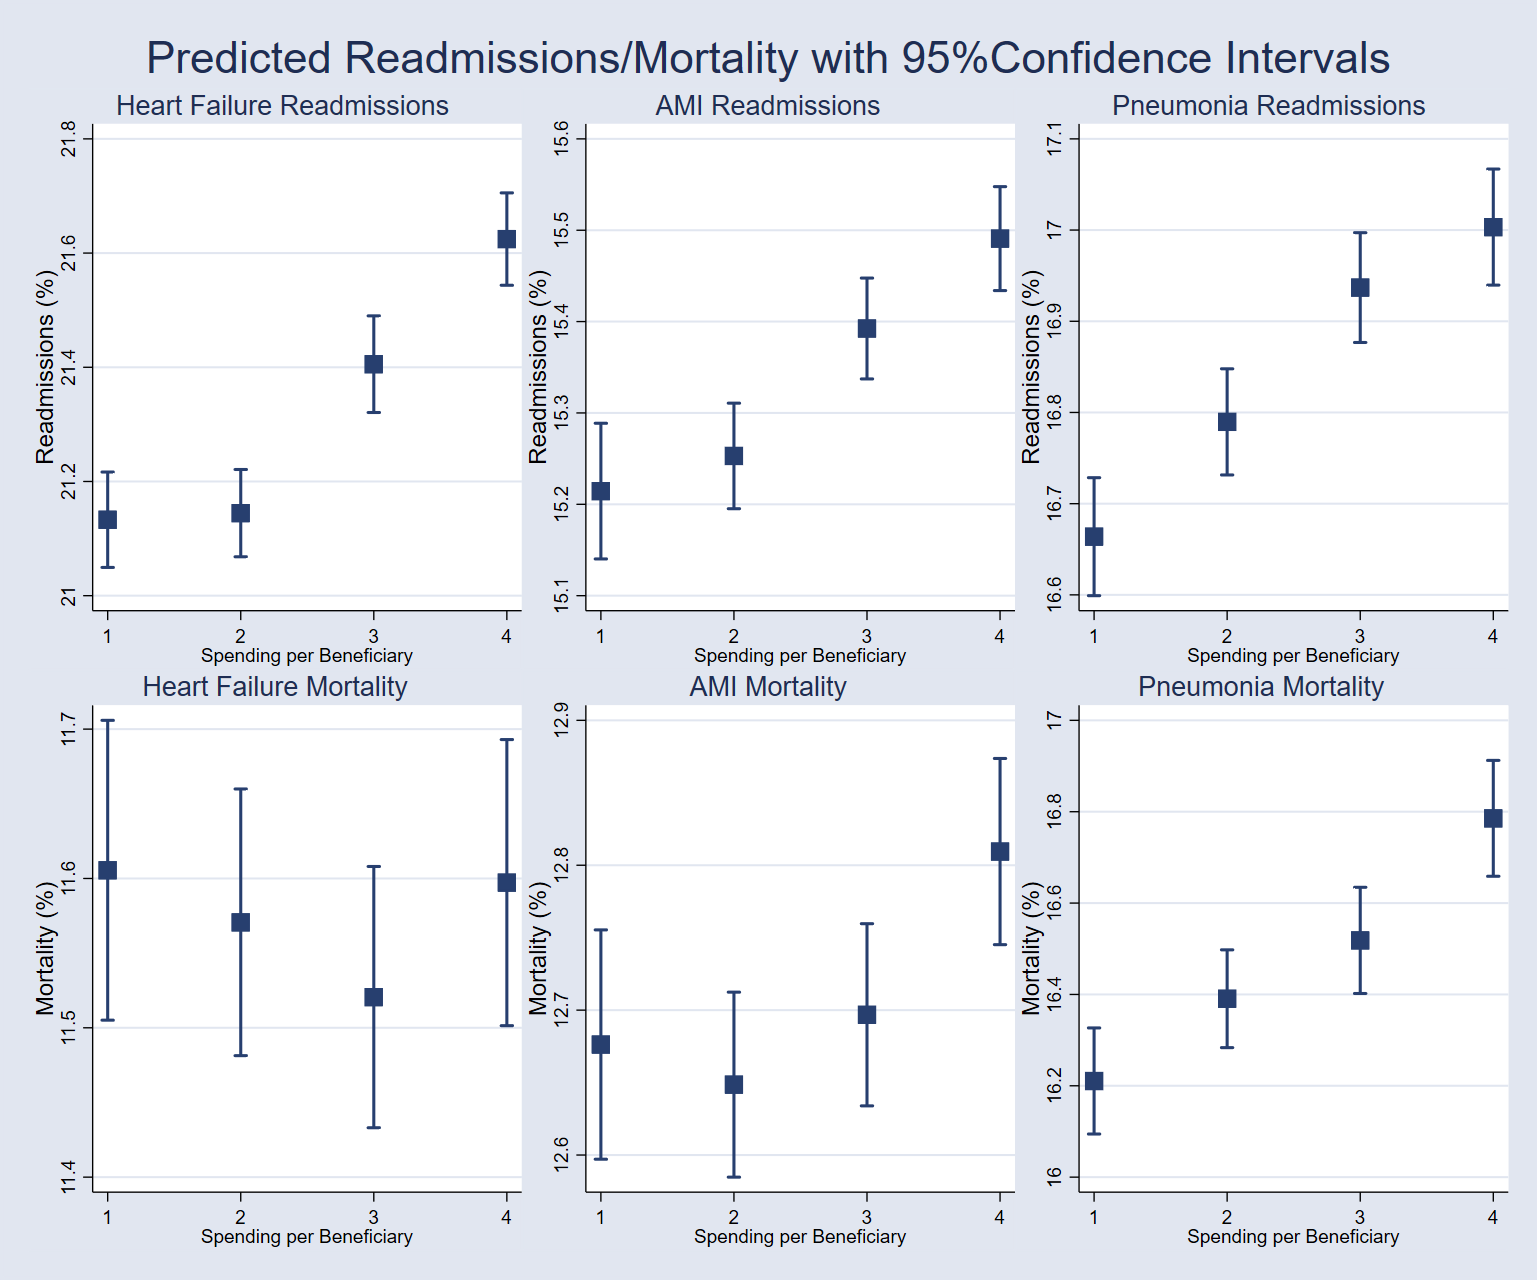
Results: Among the 3,000 unique hospitals analyzed, 41% (1,237) had MSPB values above national average. Compared to hospitals with MSPB at or below the national average, hospitals with above-average MSPB were more likely to be teaching institutions (40.7% vs. 27.4%; P< 0.001), located in urban areas (86.5% vs. 65.3%; P< 0.001), and for-profit (29.6% vs. 14.4%; P< 0.001). In unadjusted analyses, hospitals in the highest MSPB quartile had significantly higher 30-day readmission rates across all three conditions compared to hospitals in the lowest quartile, with differences of 0.54% for heart failure (HF), 0.33% for acute myocardial infarction (AMI), and 0.46% for pneumonia (all P< 0.001). These hospitals also had higher pneumonia mortality rates (0.28%; P=0.003) but no significant difference in AMI mortality (0.01%; P=0.88) and a lower HF mortality rate (-0.50%; P< 0.001). In adjusted models, hospitals in the highest MSPB quartile had increased 30-day readmission rates compared to those in the lowest quartile, with differences of 0.49% for HF (95% CI: 0.37, 0.61; P< 0.001), 0.28% for AMI (95% CI: 0.18, 0.37; P< 0.001), and 0.34% for pneumonia (95% CI: 0.25, 0.43; P< 0.001). Mortality rates for AMI (0.13%; 95% CI: 0.03, 0.24; P=0.013) and pneumonia (0.57%; 95% CI: 0.40, 0.75; P< 0.001) were also higher in the highest quartile, while HF mortality did not differ significantly between quartiles (-0.01%; 95% CI: -0.15, 0.13; P=0.91) (Figure).
Conclusions: We found that risk-adjusted higher spending was associated with poor hospitalization outcomes. Factors responsible for this relationship need further study, and practices and policies need to align healthcare outcomes with healthcare spending.