Background: Healthcare research has traditionally relied upon data collected from clinical trials and data generated from patient registries and insurance claims to drive analyses. As electronic health records (EHR) and computerized physician order entry have proliferated, large quantities of healthcare data is being generated daily through their routine use. A form of “big data,” this trove of readily available information promises insight through meaningful analysis.
An interesting and seldom quantitatively explored area is the use of consultants in the care of hospitalized patients. Data generated by the EHR system at our hospital, specifically the provider documentation system, made analysis of consult patterns possible.
Purpose: To analyze and gain insight into consultation volume and patterns, using analysis of large volumes of provider documentation data made possible by the EHR system. Specifically, we aimed to generate the “consultancy curve,” or volume of consultant visits over the days of a hospitalization.
Description: Data pertaining to provider notes was extracted from the EHR for the months of August 2016 through January of 2017. Only attending physician notes were included the analysis. For each provider note, data included the hospital admission, the author, the author’s specialty, the date and time that the note was signed, as well as start and end times of the hospital admission. From this dataset, we performed three separate but related analyses.
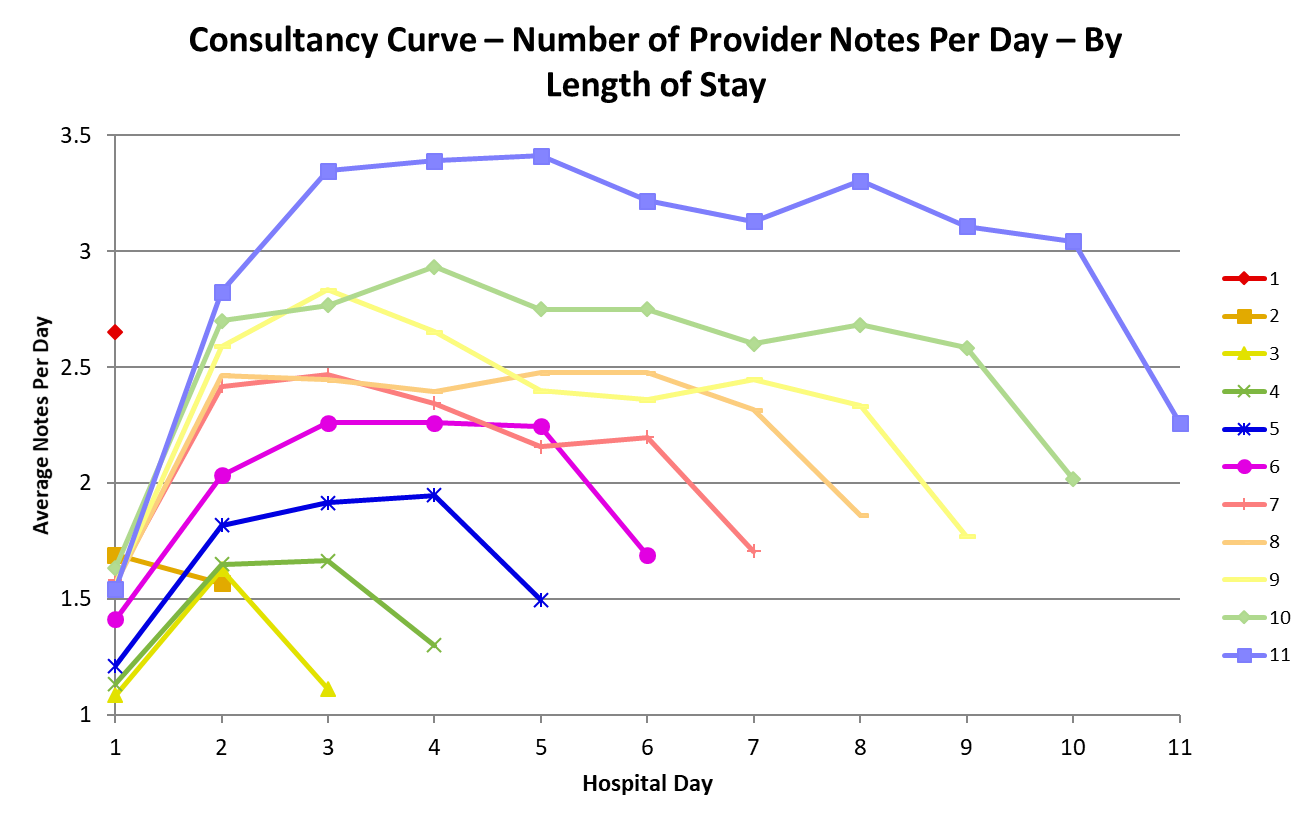
The first analysis comprises of the concept of the “consultancy curve,” or the average number of consultants seeing a patient at a given point during the hospital stay, with time being measured in days of hospitalization. We measured the number of distinct attending notes written in the HER for a given day of hospitalization, with the assumption that the one of the notes would be authored by the primary attending. Any additional notes were assumed to be consultant notes, an assumption that was confirmed by the independent authors through individual review of a sample of hospitalizations in the dataset. When the number of attending notes per day is plotted versus the hospital day, the “consultancy curve” is visualized. See the attached figure.
Two additional analyses comprised of a comparison of the pattern of provider documentation on the day of discharge versus other hospital days, as a tool to aid efforts toward early-in-the-day discharge, as well as an analysis of the correlation between time of discharge and the number of consultant notes (a surrogate for the consultant volume) on the day of discharge.
Conclusions: Data, or more correctly metadata, of provider notes allowed us to conduct large scale analyses with the specific aim of elucidating the “consultancy curve,” or the pattern of consultant volume over a patient’s hospitalization. To our knowledge, this analysis of a large, EHR-derived dataset is novel in method and concept, and presents a valuable tool to analyze consultation patterns in the hospital.