Background: Emergency department (ED) overcrowding is associated with a range of negative outcomes, including increased patient morbidity, decreased patient satisfaction, provider burnout, and violence against providers. ED boarding of admitted patients coupled with increasing ED patient volumes contributes to overcrowding. Geographic localization, where hospitalist provider teams are assigned patients on the same inpatient unit, has been explored as a potential solution. Studies on localization revealed improved physician-nurse communication, but data on its impact on ED boarding, inpatient length of stay, readmission rate, mortality, and patient satisfaction scores are limited.
Methods: This process improvement project was conducted at a 700-bed academic hospital with 16 inpatient hospital medicine (HM) teams, including 5 teaching teams. Before July 2022, inpatient teams were located across 11 inpatient units in 3 different towers. On 7/11/22 (PDSA1), each HM team was assigned a designated unit, initiating a “bed before team” model for 11 direct care teams. For patients admitted during various admitting shifts, instead of an immediate team assignment, patients were placed on a “medicine transition team” to be distributed to the various HM teams based on their unit at 6 am. We maintained a “team before bed” model for teaching teams during this improvement cycle. We implemented a weekly re-shuffle of direct care teams on our hospitalist switch day which corrected non-localized patient assignments. On 12/1/22 (PDSA 2), we refined our “bed before team” model by creating an ED based team that would manage patients until they were transferred to the floor. We also implemented the “bed before team” model for teaching teams. Patients admitted by teaching teams would be managed by the teaching teams in ED but the assigned unit would determine the patient’s team for the remainder of the admission. On 2/1/23 (PDSA 3), we refined this process by assigning specific beds to each team with bed planning actively determining assignments. Throughout this process since July 2022, we have maintained twice daily multi-disciplinary discharge planning rounds for each localized unit focusing on discharge planning and identifying discharge barriers with designated escalation pathways.
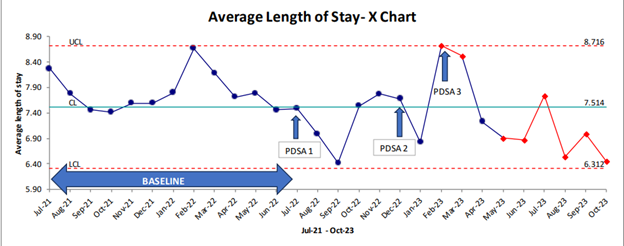
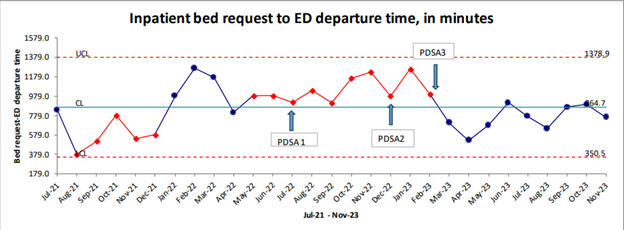
Results: During PDSA 3, Geo-localization reached 79%, daily census averaged 286, and ED visit volumes increased from a baseline of 5662.5 patients per month to 6177.5 patients per month (p-value 0.06).Outcome metrics: Figure 1 shows a non-random decline in HM Average Length of Stay (ALOS) during PDSA 3. Figure 2 displays a reduction in time between ED inpatient bed request and patient’s departure from the ED. Balancing metrics: No significant changes were observed in the risk-adjusted readmission rates (Observed to Expected ratio 0.71 versus 0.75, p-value 0.59) and risk-adjusted mortality (Observed to Expected ratio 0.37 and 0.36, p-value 0.95) between the baseline period (N=8415) and PDSA 3 (N=6349). Similarly, there was no significant alteration in the HCAHPS top box score for communication with providers between February 2022 and January 2023 (80.56%, n=440) and February 2023 to October 2023 (85%, n=263), p-value 0.11.
Conclusions: Our study revealed Geo-localization significantly improved ALOS and ED departure times without impacting readmission rate, mortality and patient satisfaction scores. The most significant improvements were observed after assigning specific beds to teams and deferring team assignment to bed planning (PDSA 3).