Background: In July 2021, our institution launched the Better Flow Program, aimed at streamlining patient flow by documenting the Medically Ready for Discharge Date (MRDD) and the Discharge Delays (DDs) in the electronic medical record (EMR). The MRDD is the date at which a patient is deemed clinically stable for discharge by their medical team. The DDs describe the reasons why a patient remains in the hospital beyond the MRDD, for example, due to issues with placement. In November 2023, of the patients discharged from one medicine unit, only 2.6% had a DD entered, despite 84% of patients identified as medically ready for discharge. Understanding the existing barriers to discharge allows for better allocation of resources and improved hospital throughput.
Methods: Our SMART aim was to increase entry of DDs from 2.6% to ≥10% in hospitalized patients on a twenty-six-bed Medicine unit between November 2023 and September 2024. We implemented Plan-Do-Study-Act (PDSA) cycles utilizing in-person and email communication to interdisciplinary teams consisting of pharmacists, nurses, residents, faculty, care coordinators, and social workers for many months. The highest yield intervention was a “soft force function” in the EMR. This entailed incorporating specific columns into the resident’s personalized patient lists for the MRDD and DDs. This served as a visual daily reminder and provided a direct link for data entry. The MRDD and DDs were tracked for all patients on this unit. We met our goal starting December 2023, so we adjusted our goal to increase entry of the DD by ≥13% between July 2024 and December 2024.
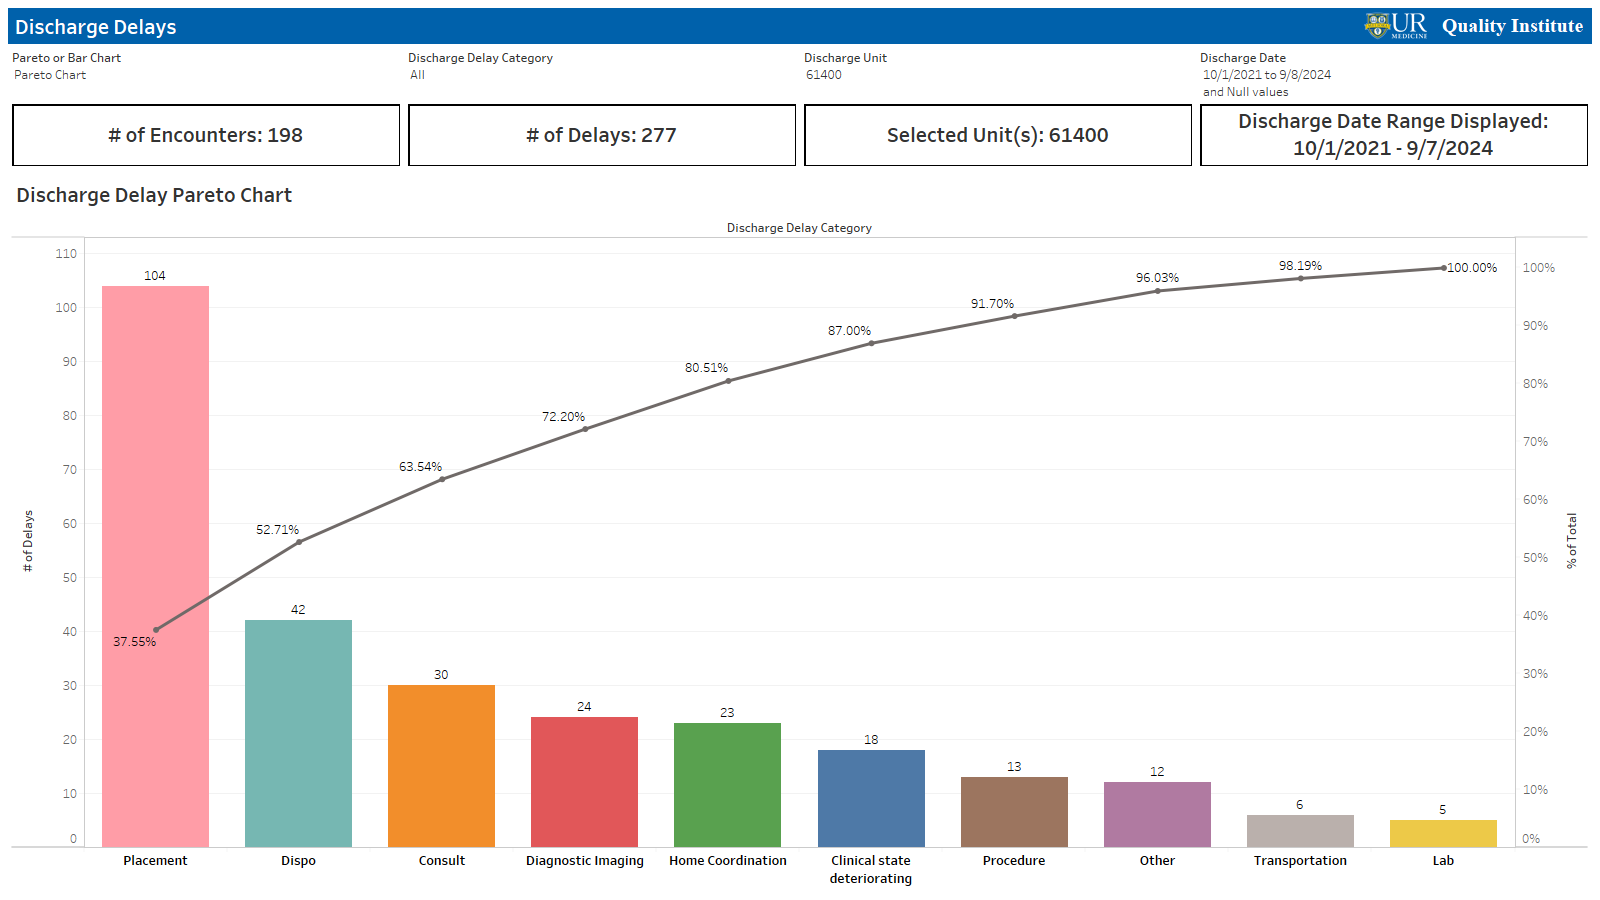
Results: Since the pilot initiation in November 2023, the percentage of documented DDs for patients discharged beyond the MRDD was sustained above the target of 10% and peaked at 24% in February 2024. (Figure 1) Data demonstrated a sustained shift above our median center line for six consecutive months, demonstrating significance. While in July 2024 the entry dropped to 8%, it has subsequently returned to ≥ 10%. We found that the most common barriers to discharge include placement (39%, specifically bed availability), disposition changes (15.5%, specifically unsafe discharge), consults (11.6%, specifically physical therapy (PT)), and imaging (8.1%, specifically echocardiogram (Echo) and magnetic resonance imaging (MRI)). (Figure 2) MRDD entry was tracked as a balancing measure, with a grace period for entry of up to two days beyond the MRDD. In February of 2024, the percentage of DD entry and the percentage of patients discharged two days after the MRDD converged at 24.5%. These results showed us that the MRDD was updated and utilized to alert providers to update the DDs.
Conclusions: We concluded that documentation of the MRDD and DDs improved with resident education and incorporation of these data fields into the senior resident rounding workflow in EMR. Entry fluctuations during periods of trainee turnover as seen in July 2024 highlights the need for a system integrated intervention to ensure sustainability during these times.By reaching ≥ 10% entry of DDs, we discovered potential areas for improvement. This information has created further opportunities for quality improvement initiatives to decrease time to Echo, MRI, and PT. In future iterations of our project, we plan to stratify data obtained on DDs and correlate it with age, race, and social vulnerability index (SVI). Further analysis may determine if higher SVI is associated with increased length of stay and if disparities exist amongst certain demographic populations.