Background: The proportion of high-level bills submitted by our hospital medicine group was lower than national averages as reported by the Clinical Practice Solutions Center (CPSC). This did not seem to align with the complexity of patients at our level 1, safety net hospital in a busy urban location. The purpose of our project was to align the proportion of level 3 bills for initial inpatient service notes (Current Procedural Terminology or CPT 99223) and subsequent hospital services (CPT 99233) and level 2 bills for discharge management services (CPT 99239) to national benchmarks.
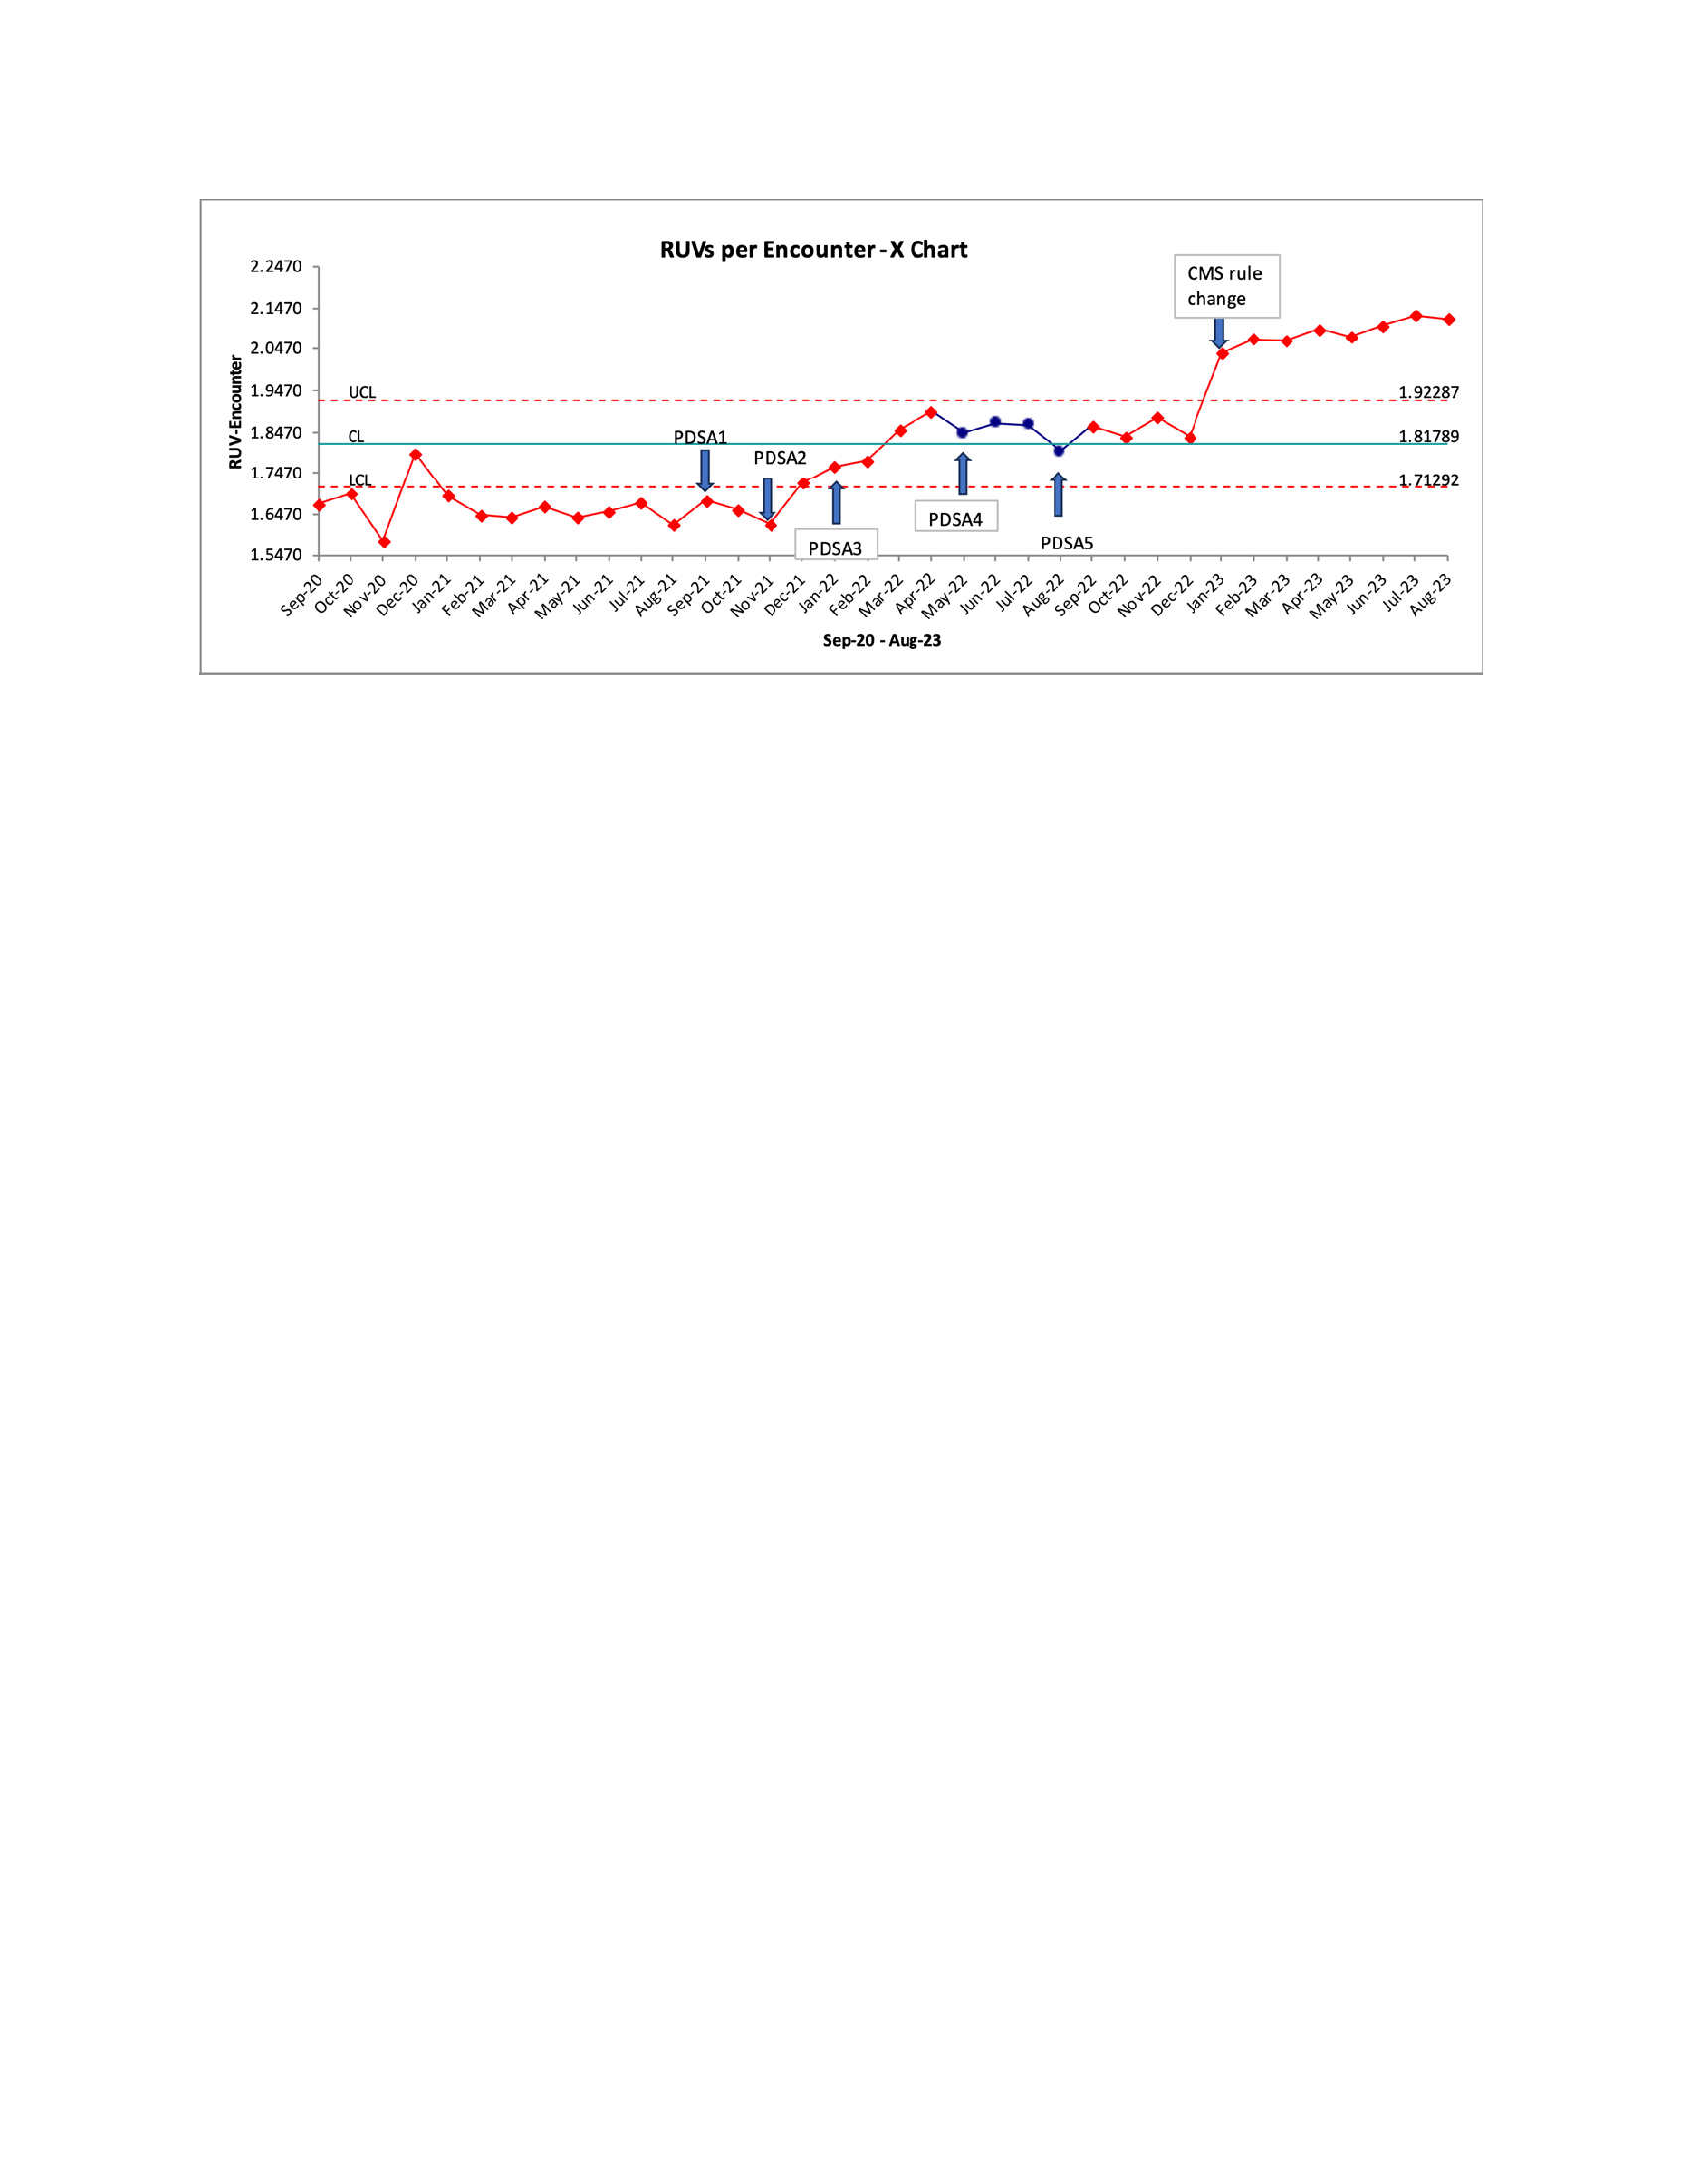
Methods: We took a process improvement approach using the Institute for Healthcare Improvement’s Model for Improvement framework. A needs assessment was performed through one-on-one meetings and group discussions with hospitalists and Department of Medicine (DOM) billing and finance teams. We started our improvement efforts in Fall 2021 with quarterly educational sessions on billing best practices (PDSA 1). In November 2021, we introduced feedback packets showing individual provider performance on levels of billing, compared with peers and national CPSC benchmarks (PDSA 2). We also tackled institutional guidelines on copied and pasted information in subsequent progress notes. Prior to January 2022, coders disregarded all copied and pasted information when assigning billing levels. Starting January 2022, institutional guidance was changed to give credit to copied and pasted information if appropriate updates were in place (PDSA 3). In May 2022 (PDSA 4), we created monthly “clearance cohorts” to clear providers to bill on their own instead of sending their notes to department coders. Four hospitalists were selected each month. Their notes were reviewed by a DOM billing educator who provided individualized feedback. At the end of each month, notes of the 4 selected hospitalists were reviewed and clearance to bill granted to individuals meeting institutional criteria. In August 2022 (PDSA 5), we incorporated the goal of meeting or exceeding CPSC medians for level 3 billing into the division incentive plan.
Results: The proportion of 99223, 99233 and 99239 bills increased between Financial Year (FY) 2021, 2022 and 2023 (figure 1). Chi-square test for comparison of proportion of 99223, 99233 and 99239 bills in FY 21 versus FY 22 and FY 22 and FY 23 resulted in p-values < 0.0001. The proportion of physicians cleared to bill increased from 0 of 11 audited in FY 21, 7 of 15 in FY 22, and 11 of 20 in FY 23. Relative Work Units (RVUs) generated per clinical full time equivalent physician increased from 4123 (137,393/33.42) in FY 21, to 4313 in (154,750/35.88) in FY 22, and 4359 (181,940/41.74) in FY 23. RVUs generated per encounter increased from 1.66 in FY 21, to 1.78 in FY 22 (p-value 0.0011), and 2.01 in FY 23, p-value < 0.0001 (figure 2).
Conclusions: Our process improvement-based approach resulted in a statistically significant increase in billing levels, so they approximated national benchmarks. This was accompanied by a financially meaningful increase in RVU generation per encounter. We saw the greatest improvement in billing levels after the introduction of provider feedback packets (PDSA 2) and change in institutional guidance on copy and paste (PDSA 3). We also saw a significant increase in billing levels after the new Center for Medicare Services rules for inpatient billing went into effect in January 2023.