Background: There is minimal automated electronic feedback to hospitalists about their level of service in professional billing. Based on today’s payor requirements for inpatient admission, the medical decision-making involved in the care of inpatients almost always justifies a level of service above level 1. However, encounters may still receive level 1 due to under-documentation (e.g. missing family history). This leads to underbilling, lost revenue, and provides an opportunity to improve the value of hospitalist care.
Purpose: To reduce the percentage of inpatient notes that are billed at level 1 (lowest level) in an academic hospitalist group.
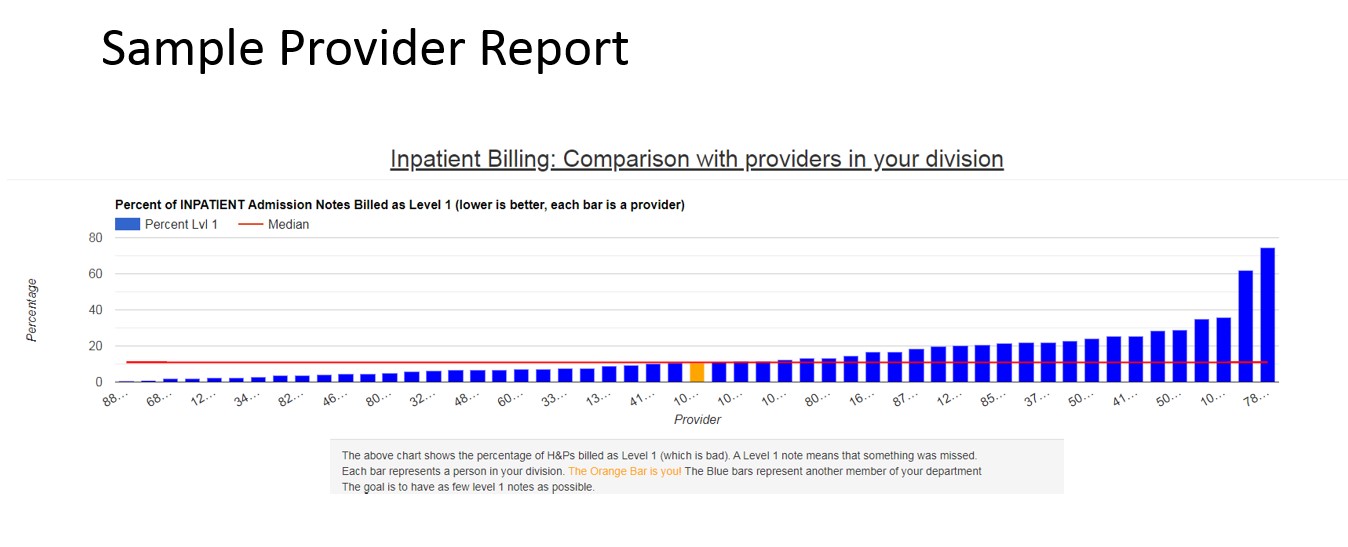
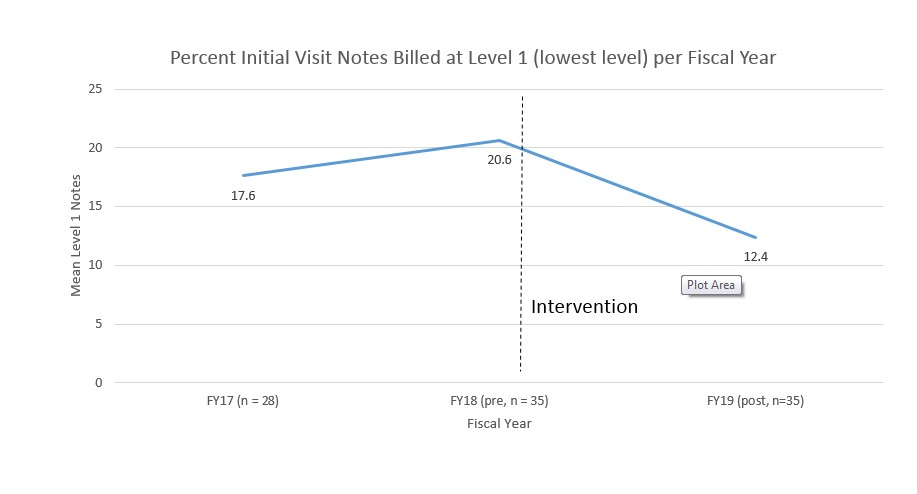
Description: Prior to the project, all physicians received education and personalized feedback on billing annually. There was no system for faster feedback. We reviewed our inpatient EHR tools and saw no existing tools to achieve our goals. We designed and built a self-service feedback tool. We automatically queried physician charges from our electronic health record (Epic) using the Clarity database and analyzed, for each provider, the percent of initial visit notes (H&Ps and initial consult notes) billed at level 1 (99221). A web application was created where providers could log in and view their own reports. The report included a bar chart showing the percent of level 1 notes for each provider in the group (anonymized), sorted by rank. It also listed all of the provider’s level 1 notes with a link to view the note text. Providers were given access to the tool in July of 2018 and had ongoing access to the tool, which updated weekly. Notes were loaded in once a level of service was assigned by chart abstractors – typically within 1 week of signing. We compared the percent of notes billed at level 1 for the year prior (FY18) to intervention to the year after (FY19) using a paired t test. For providers with data two years prior to intervention, we also compared the change from two years prior to intervention (FY17) to 1 year prior to interPreliminary data shows the following: There were 42 providers with data during the two year span. 35 of 42 providers viewed their own report at least one time. On average, providers went from 20% of notes billed at level 1 to 12.5% of notes billed at level 1 (p < .0005). There was no change in billing for the 7 providers who did not review their reports. In a subset analysis of 28 providers who had data for two years prior to intervention, there was no difference in their billing for the two years before the intervention. The reduction in low level billing for initial notes translates to approximately 40,000$/year at a conservative estimate for our group.
Conclusions: An application providing physicians with comparison of their billing to their peer group, along with easy one-click access to notes that could have been billed higher, resulted in a reduction in notes billed at the lowest level. This application is scalable to other departments within our health system and to other users of the Epic EHR.