Background: Limited hospital capacity continues to be one of the major challenges to health care in hospitals in the US and the developed word. This problem manifests in a variety of ways in multiple settings starting with prolonged emergency room wait times and left without being seen rates, prolonged ED boarding time, and elective surgery cancellations. Hospital leaders struggle with the increasing costs of hospital expansions: one estimate of the cost of adding a single bed to a hospital is about 1 million dollars a year, hence many hospitals focus on increasing efficiency in patient throughput, early discharges with outpatient F/U, and reducing re admissions to avoid the cost of expanding inpatient beds. As a result of these policies a significant portion of hospitals run at a higher capacity with resultant higher turn away rates for patients.
Methods: Hypothesis: Is hospital crowding, defined as a turn away rate of more than 0.1% ,an independent risk factor for worse outcomes in academic hospitals after adjusting for other risk factors like age, sex, co-morbidity,etc. We compare hospital related outcomes (mortality,VTE,readmission etc.) between crowded and non-crowded hospitals with crowding defined as turn away rate more than 0.1% . Hospital Size were obtained from American Hospital Association AHA Survey and Vizient data base. average daily occupancy was calculated using total bed days from both observation and inpatient discharged from each hospital and calculated average daily capacity occupancy rate for each hospital, then used the Erlang calculator to determine the average daily turn away for each hospital based on queuing theory. Based on that hospitals divided into two groups crowded hospitals ( turn away rate >0.1%) and non crowded hospitals ( < 0.1% turn away rate) , outcomes data were compared between the two groups based on reported outcome data reported to Vizient .
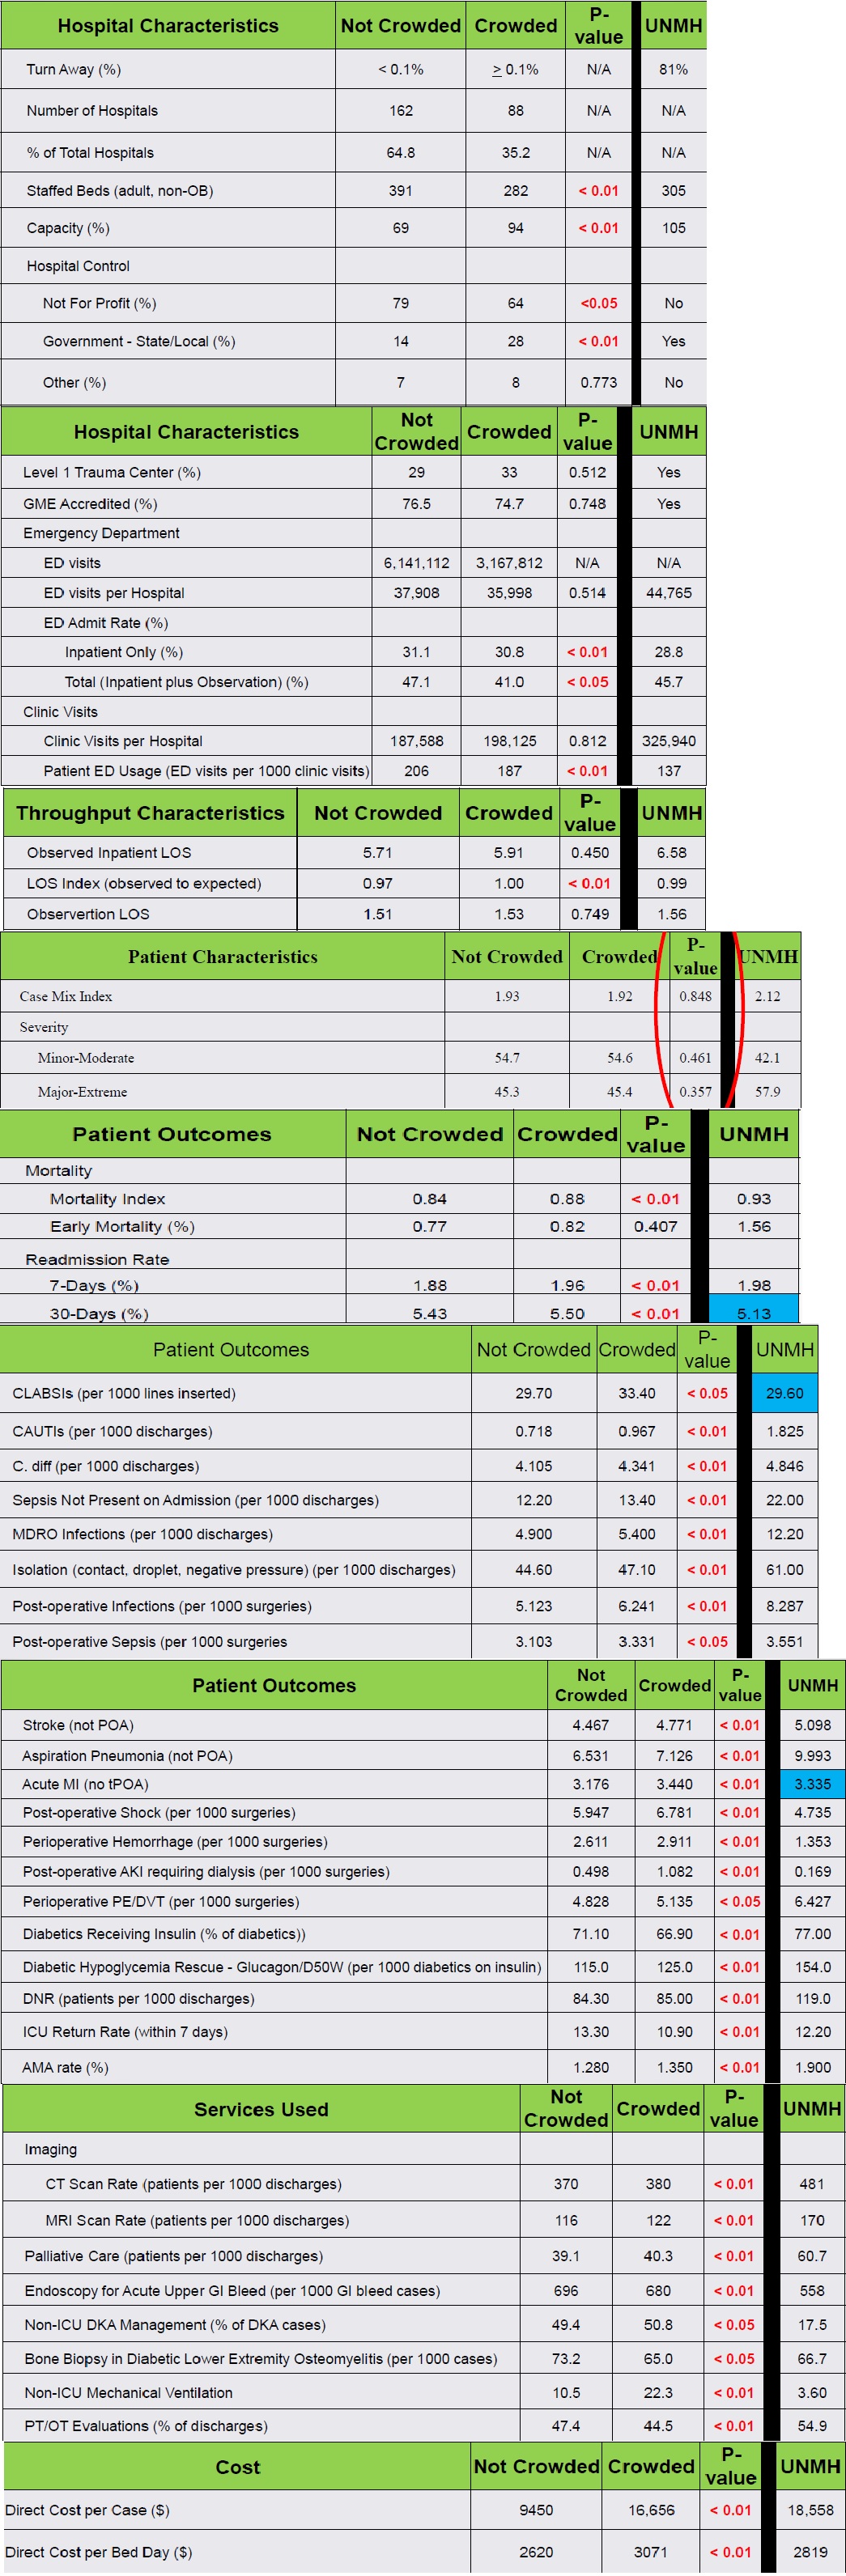
Results: length of stay index ( observed to expected was higher in Crowded hospitals than non crowded hospitals (1.00 vs 0.97 P value <0.01) . There was no difference in patient characteristics in term of illness severity hence the case mix index was not statistically different between the two groups
(Non Crowded CMI 1.93 vs crowded 1.92 P value 0.848). Mortality index was higher in crowded hospitals 0.88 vs 0.84 in non crowded hospitals (P value <0.01). Patients admitted to Crowded hospitals were significantly higher risk of getting complications like aspiration pneumonia, Acute MI post operative complications, hypoglycemia, and leaving against medical advice AMA rate. It was also noted that patients admitted to crowded hospitals used more inpatient services like imaging CT,MRI endoscopy, bone biopsies and cost was significantly higher per admission and per bed per day cost.
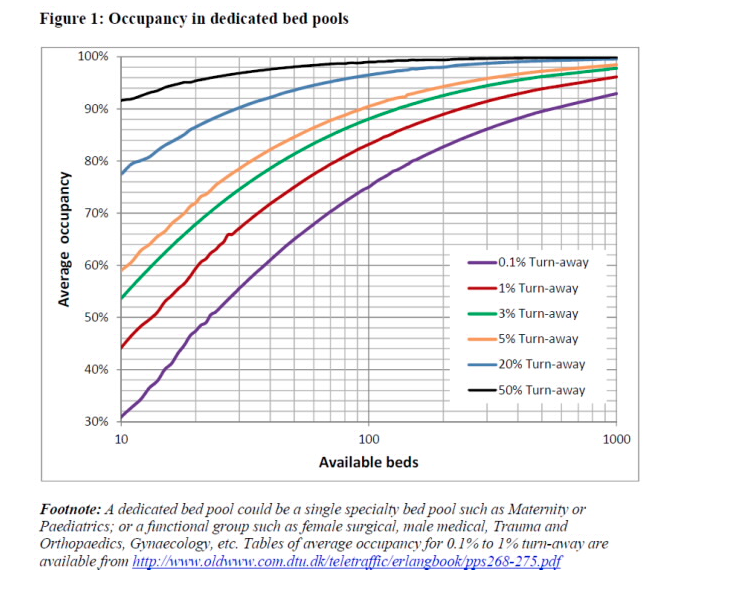
Conclusions: Smaller hospitals begin to get crowded at lower occupancy rates
-Larger hospitals can handle higher occupancy rates before crowding occurs
-Crowded hospitals on average are smaller with fewer staffed beds and are more likely to be controlled by state or local governments.
-In the Vizient risk models (used for calculations of severity, expected mortality and expected LOS), patient characteristics (i.e. age, gender, race, ethnicity, low socioeconomic status, diagnoses and co-morbidity) are weighted and controlled
-There is no difference in the complexity (CMI) or severity of patients between crowded and not crowded hospitals.
-Crowded hospitals have a higher Mortality Index and a higher LOS Index, infection rates, post-operative complications and costs