Background: Current data indicate that racial and ethnic minorities bear a disproportionate burden of COVID-19 infection and mortality (1-4). Consequently, communities with a higher proportion of minorities are expected to have a higher burden of infection and mortality, however, this hypothesis has not been tested. Therefore, we estimated the disparities across US counties in the COVID-19 infection and mortality rates.
Methods: We used three publicly available data sets: 1) county-level infection and mortality count data on November 25, 2020, from the Johns Hopkins Coronavirus Resource Center, 2) county-level demographic characteristics from the 2018 5-year American Community Survey, and 3) number of tests conducted at the state level from the COVID-19 Project website. To examine the relationship between COVID-19 infection and mortality rates and the percentage of African-Americans (AA) in the county, we conducted multilevel negative binomial regression (MNBR) analyses, with the state as random intercept and percentage of AA as random slope, without and with adjustment for county population, AA percentage, percentage with high school or higher education, percentage living in poverty, percentage uninsured, median earnings, and the ratio of houses to households. To determine the time-trends in disparities, we conducted MNBR models on the daily data from April 1, 2020 onwards. All analyses were conducted using Stata/MP 16.1 (College Station, TX).
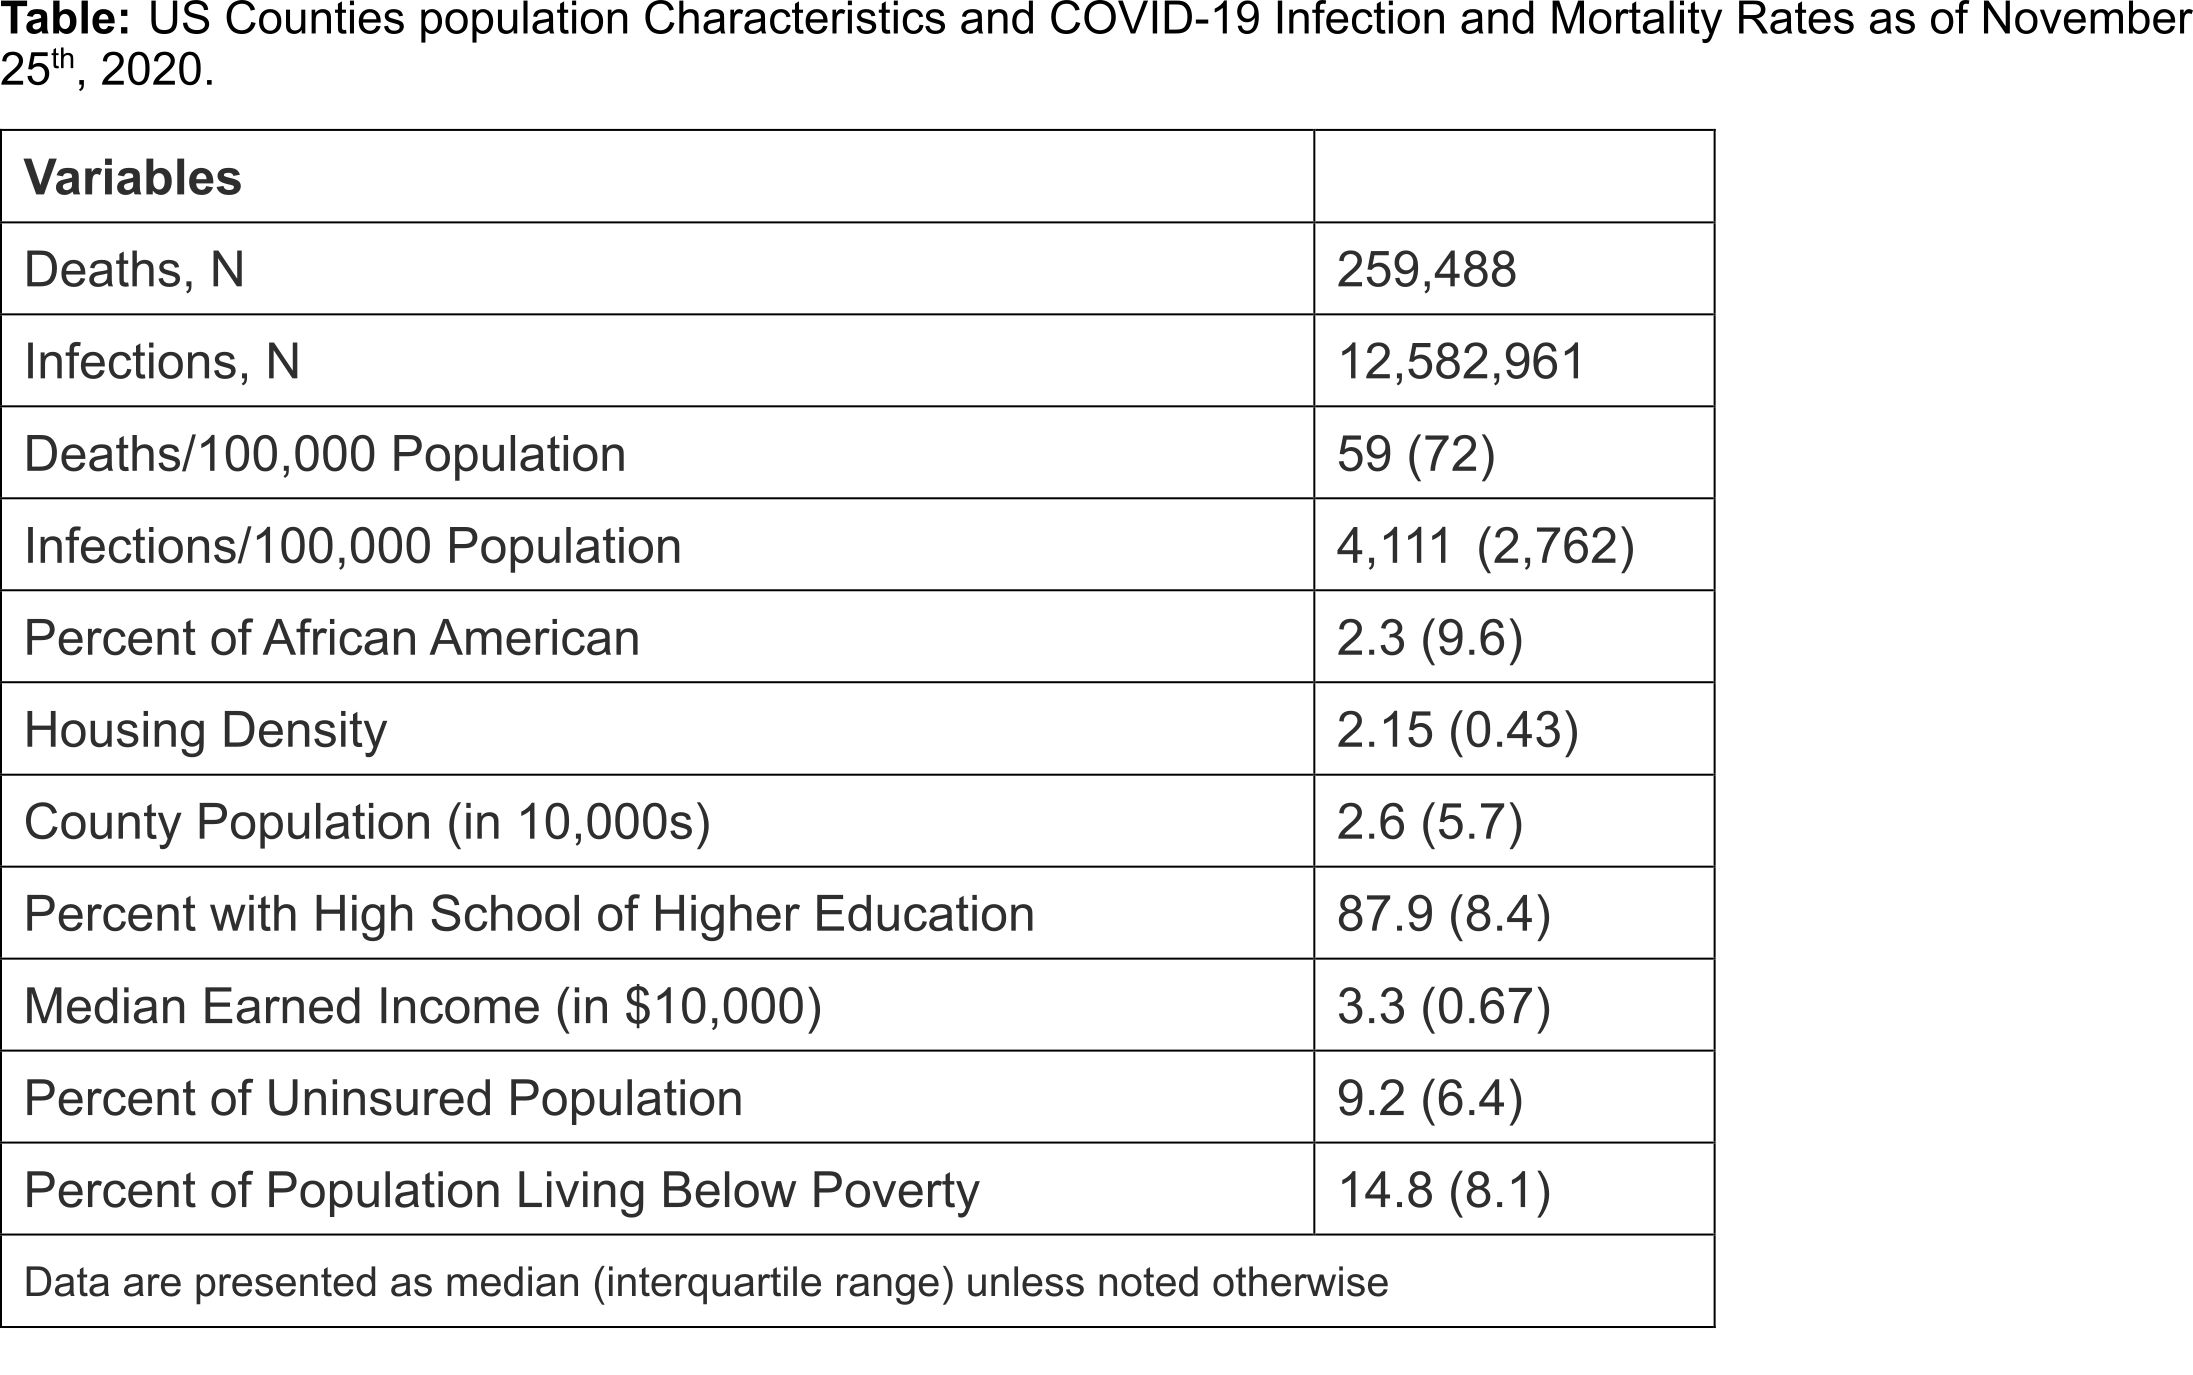
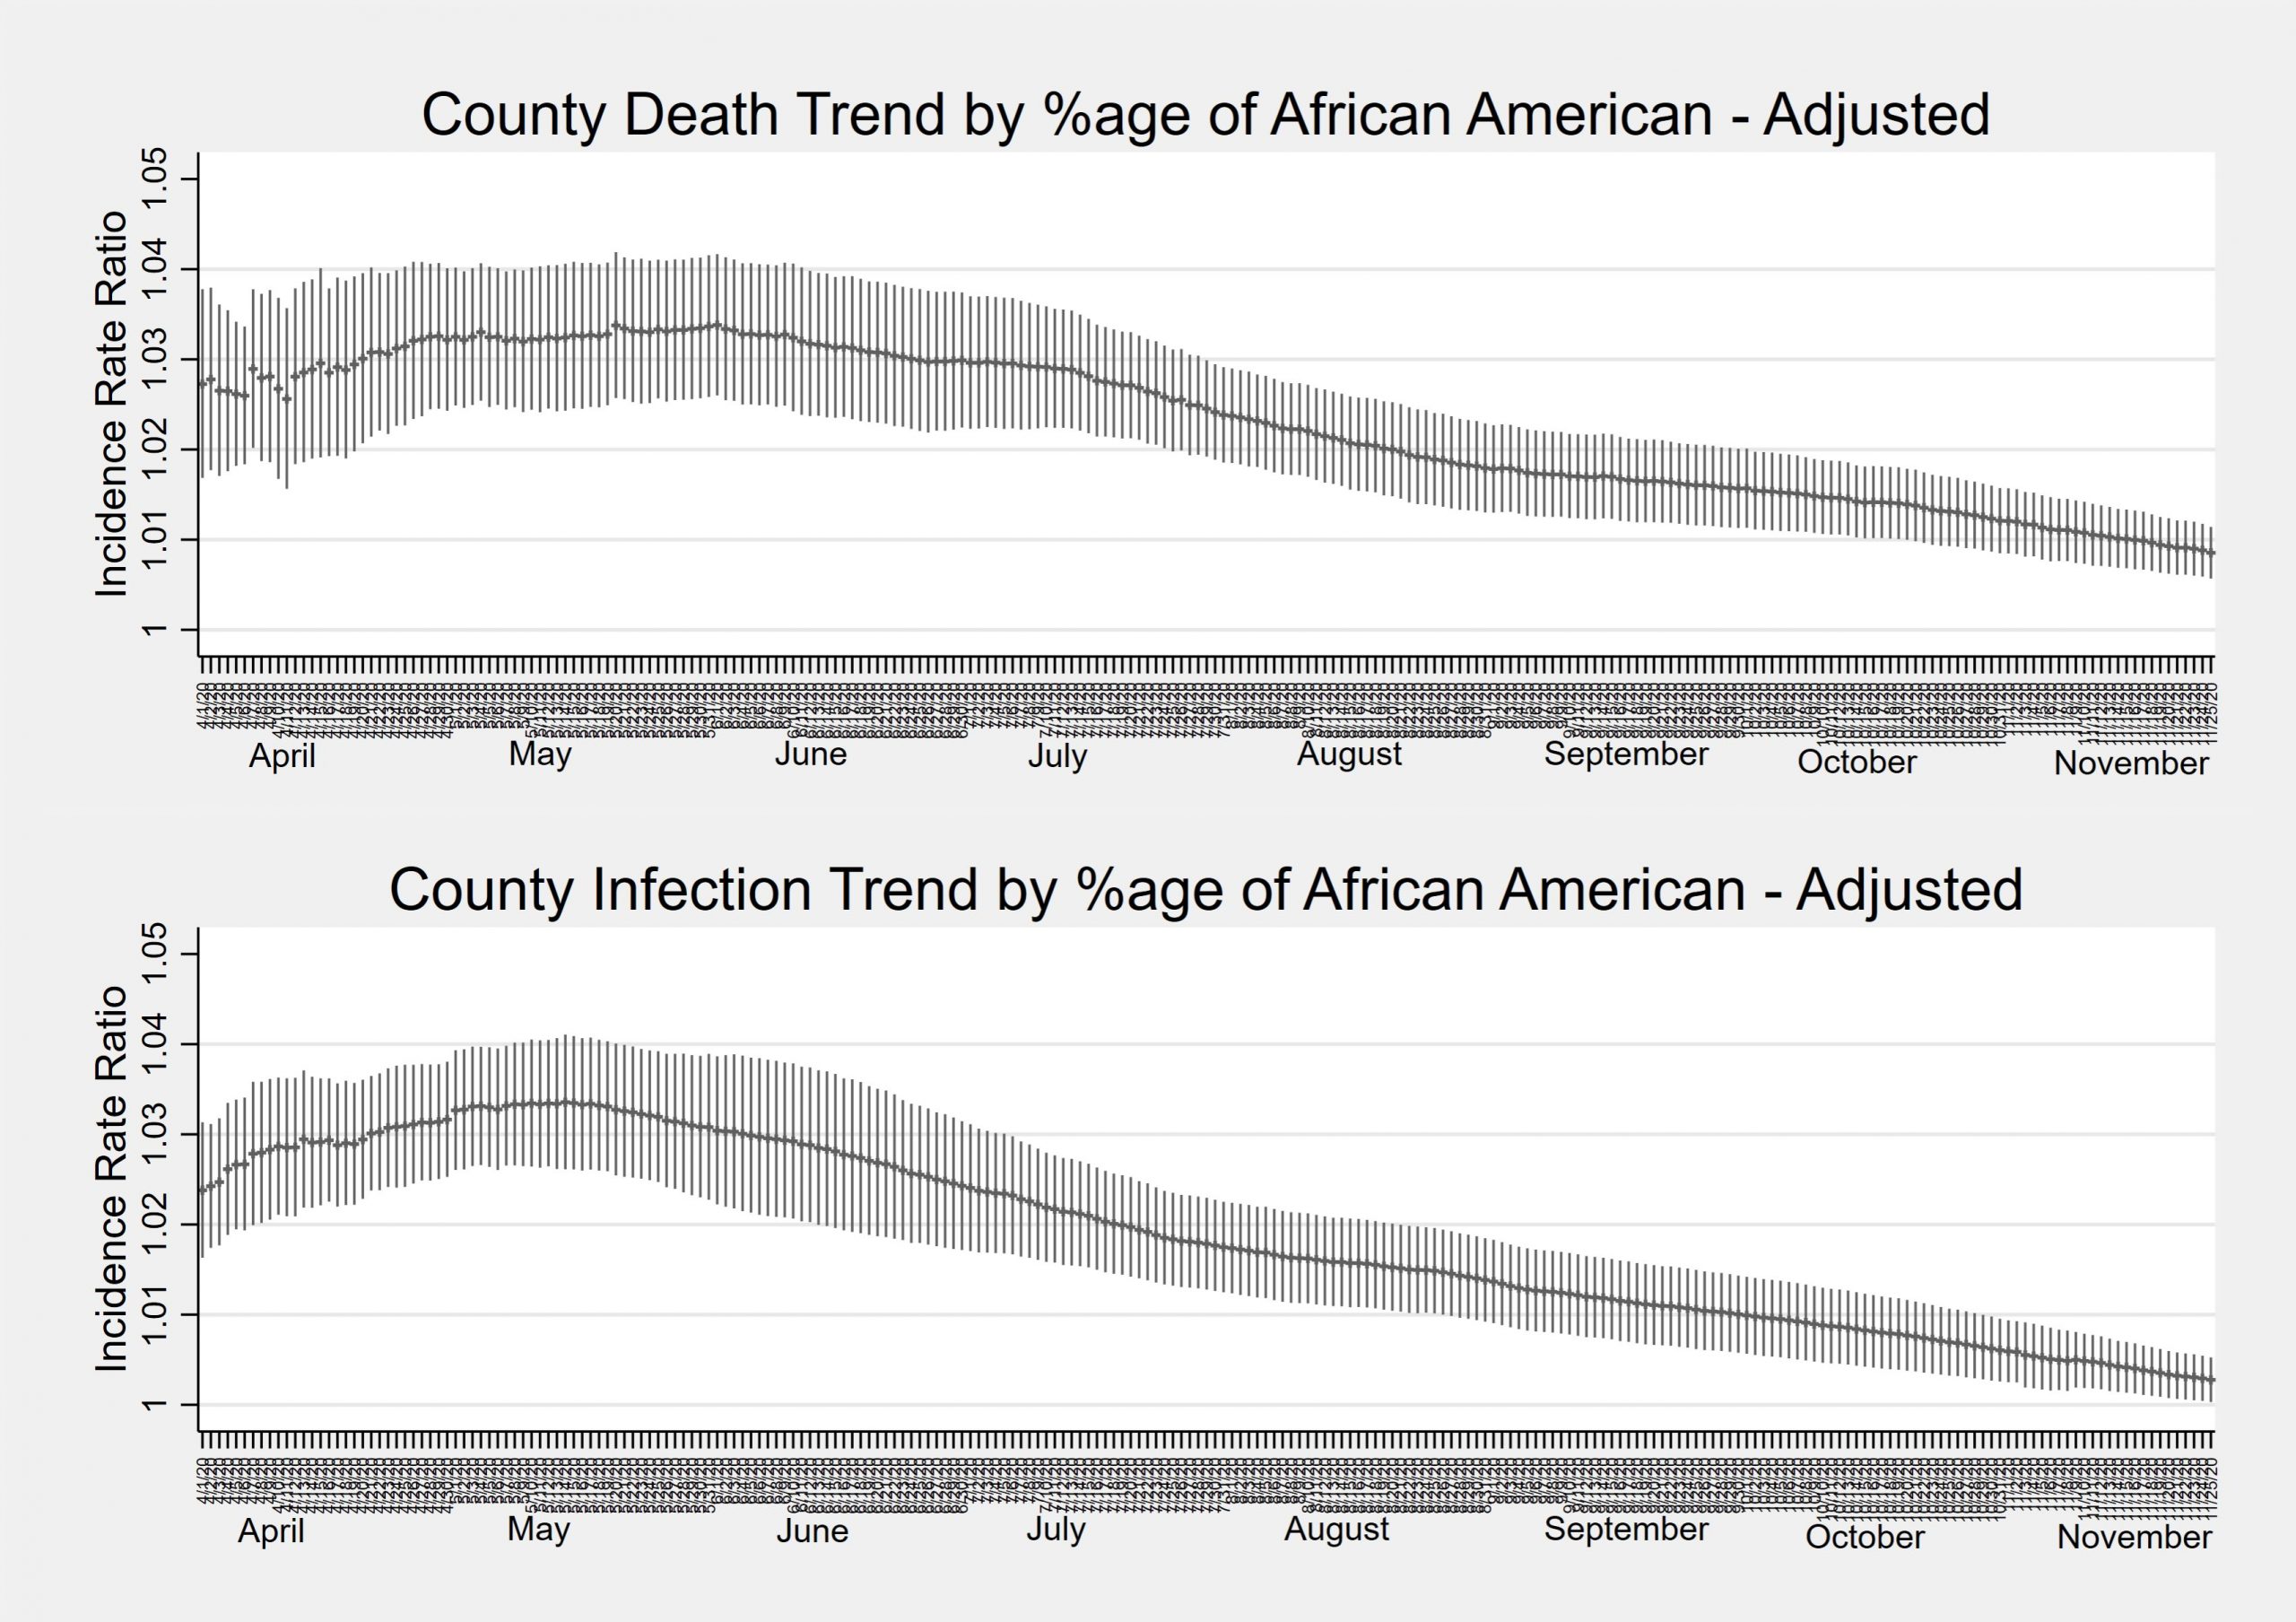
Results: Among the 3116 counties, 259,488 deaths and 12,582,961 infections were reported until November 25, 2020; 179 and 1 counties had not reported any death or infection, respectively. The percentage of AA in counties ranged from 0% to 87.4% (Table 1). In unadjusted models, a county with 1% higher AA population had 2% higher mortality incidence rate for its general population (IRR=1.02, 95%CI = 1.01, 1.03; P=0.002) and 0.5% higher mortality rate for its infected population (IRR=1.005, 95%CI = 1.002, 1.009; P=0.003). Adjustment for potential confounders did not change effect on mortality – general population IRR = 1.01 (95%CI = 1.008, 1.014; P<0.001) and infected population IRR = 1.006 (95%CI = 1.003, 1.009; P<0.001). Similarly, a county with 1% higher AA population had 1.5% higher infection incidence rate in unadjusted models (IRR=1.014, 95%CI = 1.005, 1.023; P=0.002); however, this relationship was no longer significant after adjusting for potential confounders (IRR = 1.007, 95%CI = 0.999, 1.015; P=0.08). Examination of time trends showed that after an initial rise during the early half of the year, AA-percentage-related county relative risk of mortality and infection rates are decreasing, although the risk remains higher than comparable counties with smaller proportions of AA (Figure).
Conclusions: Disparities in COVID-19 mortality and infection rates exist across US counties; such disparities are only partly explained by geographic trends in the pandemic spread and demographic characteristics of county population. These disparities warrant sustained efforts to ensure that all communities benefit from the progress in healthcare delivery.