Background: Hospitalists balance efficiency and quality in their daily practice. How a physician’s time management affects care quality is unknown. Accordingly, we aimed to compare the EHR efficiency of hospitalists, as measured by their time spent within the EHR per day, with quality of care, as measured by readmission rates and patient satisfaction.
Methods: Data were collected from the EHR of a large academic urban safety-net hospital. Time spent per day by individual hospitalists within the EHR was averaged over 4 months in 2018. 14-day readmission rates for individual physicians for all of 2017 were determined and Press-Ganey percentiles were collected from 10/2017 to 9/2018. Physicians were ranked for both measures and placed into quartiles.
Physicians in the top quartile for EHR efficiency, spending less time in the EHR, were considered High Efficiency (HE). Physicians in the bottom quartile for EHR efficiency were considered Low Efficiency (LE).
We assigned points to each quartile for 14-day readmissions and Press-Ganey scores to categorize quality of care. For both measures, we assigned 4 points to the top quartile, 3 points to the 2nd quartile, 2 points to the 3rd quartile, and 1 point to the 4th quartile. We considered a total of 2-4 points to be Low Quality (LQ) and 6-8 points to be High Quality (HQ). (Table 1)
We used Fisher’s Exact Test to test for differences between groups. Given our small sample and the operational nature of our analysis, we considered a p-value of 0.1 to be significant.
Results: The 10 HE (1st quartile) hospitalists spent twice as much time in the EHR daily, a mean of 2.9 hrs/day more (p<0.001) than the 10 LE hospitalists (4th quartile). 5.8 hrs/day (SD 0.81) v 2.9 hrs/day (SD 0.43).
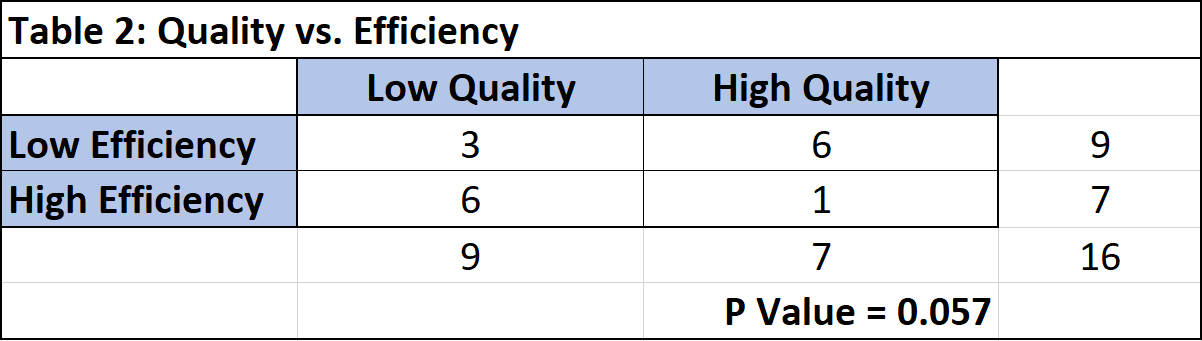
Of the ten HE physicians, 6 were LQ and 1 was HQ. Of the ten LE physicians, 3 were LQ and 6 were HQ (Table 2). LE hospitalists were more likely to be categorized as HQ (p=0.06). 6 of the 7 (85.7%) HQ physicians were LE. HQ physicians were more likely to be LE (p=0.057). While 66.6% (6/9) of LQ physicians were HE, the likelihood that LQ physicians were HE did not reach significance (p=0.37).
There were 3 LE, LQ physicians and 1 HE, HQ physician.
Conclusions: Our data suggest the hospitalists spending the most time in the EHR are more likely to provide high quality care. Three physicians were categorized as LE and LQ. These physicians may benefit from additional training, feedback and coaching. We did identify one HE, HQ provider. Using positive deviance theory, we might help all physicians adopt workflows that are conducive to higher efficiency and higher quality care.
.png)