Background:
As a requirement of the Affordable Care Act, the Center for Medicare and Medicaid Services (CMS) established the Hospital Readmissions Reduction Program (HRRP) and started reduced payments to hospitals with excess 30-day readmissions on October 1, 2012. Over the past three years, the maximum penalty has steadily increased from 1% to 3%; however, the effect of these penalties on readmission rates remains unclear. Therefore, we examined whether the 30-readmission penalties have reduced excess readmissions.
Methods:
We used data from publically accessible websites; 30-day readmission penalty data from the CMS website, local population characteristics for each hospital from the United States Census Bureau, and hospital service area information from the Dartmouth Atlas of Health Care. The CMS reports excess readmission ratio taking into account risk-adjusted expected readmissions. We used linear regression models to examine the effect of penalties on excess readmission ratio with adjustment for the region of the country and population characteristics within the hospital service area (total population, percentage of African Americans and Latinos, median household income, median age, educational status, and insurance status). Lastly, to validate our findings, we used multilevel models to account for correlation between observations from the same hospital.
Results:
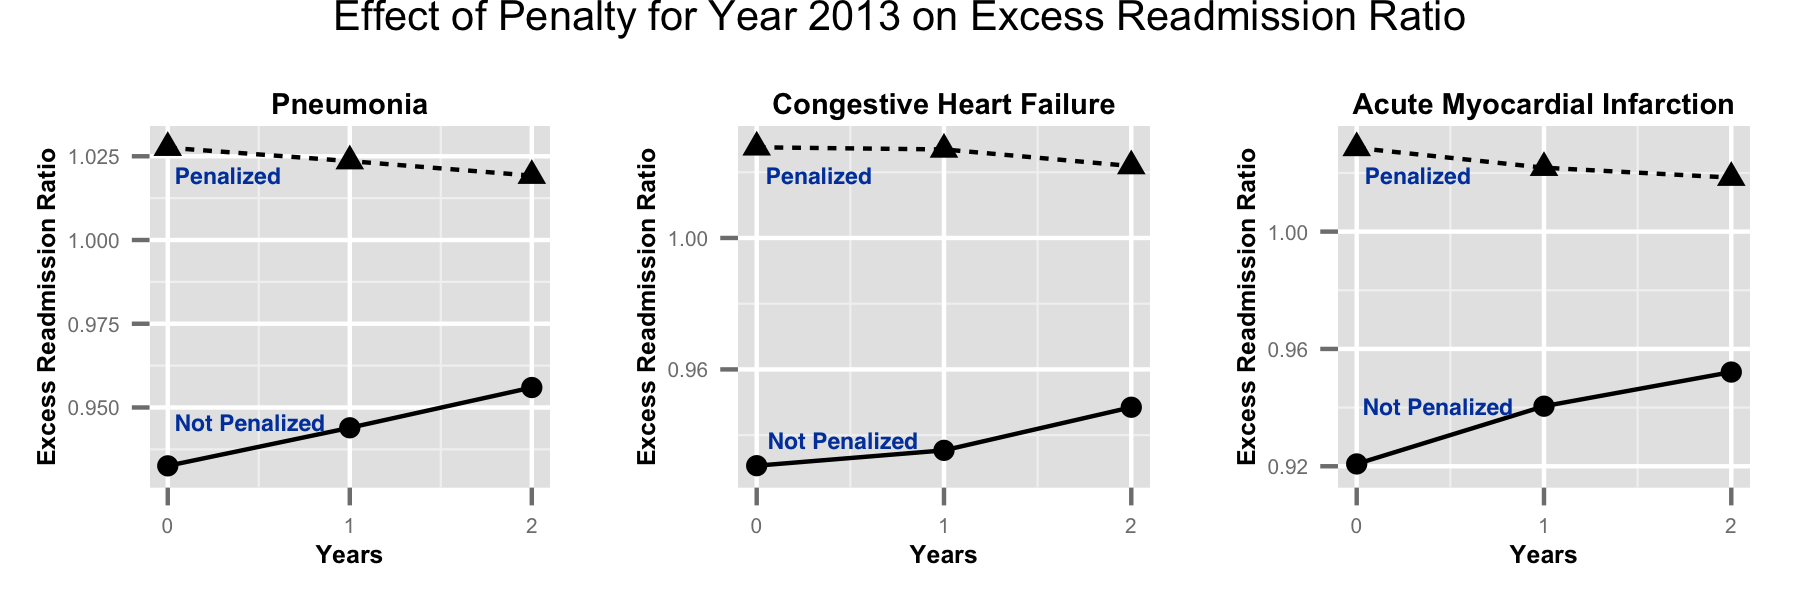
Of the 3279 hospitals in 2012 with readmission data, 2148 were penalized for adjusted excess readmission ratio. On average, penalized hospitals had 3% higher adjusted readmission ratio than expected and 8% higher than non-penalized hospitals for all three conditions. The overall excess readmission ratio for all three conditions did not change over the 3-year period (P=0.9 for all three). When examined by penalty status, hospitals penalized in 2013 had a steady decrease in excess readmission ratio although it remained higher than expected over the 3-year period for all three conditions. In contrast, non-penalized hospitals had a steady increase in excess readmission ratio (Figure, P<0.001 for interaction). The magnitude and the direction for change in excess readmission ratio remained statistically significant after adjusting for confounding variables (Table) and did not change using multilevel models.
Conclusions:
Penalizing hospitals independently and significantly reduced 30-day readmissions among hospitals that were penalized during the 3-year period as compared to those who were not. Overall improvement in readmission rate shows the responsiveness of the hospital to this measure. The overall gap between hospitals will likely be further improved through sharing of best practices.
|
Table: Change in Excess Readmissions per year during the 3-years. |
|||
|
Variable |
Penalized in 2013 |
Not Penalized in 2013 |
Interaction P-value |
|
Un-adjusted change in excess readmissions/year over 3 years |
|||
|
Pneumonia |
-0.42%, P<0.001 |
1.17%, P<0.001 |
P<0.001 |
|
Congestive Heart Failure |
-0.28%, P = 0.01 |
0.89%, P<0.001 |
P<0.001 |
|
Acute Myocardial Infarction |
-0.51%, P<0.001 |
1.56%, P<0.001 |
P<0.001 |
|
Adjusted change in excess readmissions/year over 3 years |
|||
|
Pneumonia |
-0.41%, P<0.001 |
1.21%, P<0.001 |
P<0.001 |
|
Congestive Heart Failure |
-0.28%, P = 0.01 |
0.91%, P<0.001 |
P<0.001 |
|
Acute Myocardial Infarction |
-0.55%, P<0.001 |
1.51%, P<0.001 |
P<0.001 |