Background: Diagnostic error (DE) matters in medical safety, threatening high-quality care. The frequency of DE is known to differ among each disease, and that of pulmonary embolism (PE) is estimated as 18-38%. While PE is recognized as a crucial pathology in DE, little is known about attributable factors in errors of PE. This research attempted to investigate the incidence rate of PE diagnostic error in primary outpatient clinic and emergency room (ER), and the association between DE and chart description of relevant symptoms or objective findings from patients.
Methods: This research is a single-center retrospective observational study. Participants were patients who visited our outpatient clinic or the ER from April 1st, 2017, to March 31st, 2022, then got registered as pulmonary embolism or pulmonary thromboembolism. After removing cases suspected of PE, post-treatment or chronic PE, duplicates, and pediatric cases, we further excluded in-hospital onset PE, transfers, and incidental asymptomatic PE detected on contrast-enhanced CT. Each case was evaluated DE or not with Revised safer Dx Instrument. The analysis included environmental factors, whether the medical records at the first visit include significant findings for PE, and patient demographics. For DE analysis, the Diagnostic Error Evaluation and Research (DEER), Reliable Diagnosis Challenges (RDC), and Generic Diagnostic Pitfalls (GDP) taxonomies were adopted, and each patient harms were classified by National Coordinating Council for Medication Error Reporting and Prevention (NCC MERP) Index for Categorizing Medication Errors. A logistic regression analysis was performed with the non-DE group as the reference for comparisons between DE and non-DE group.
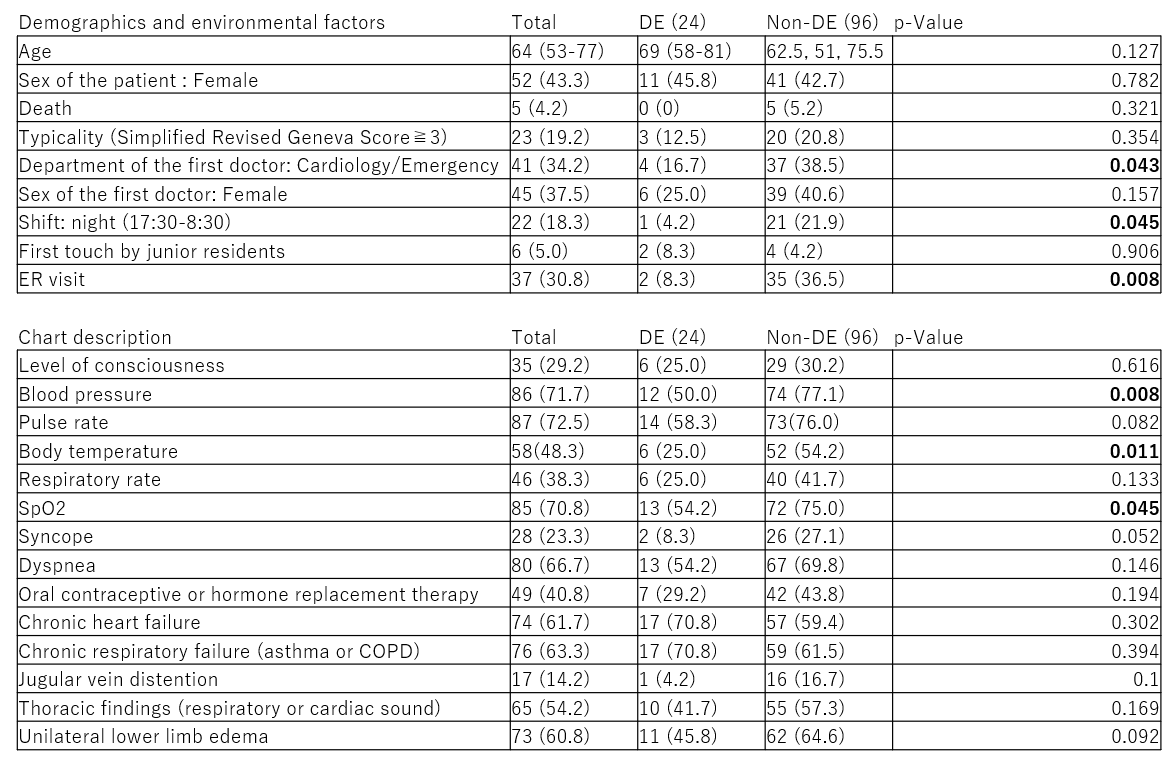
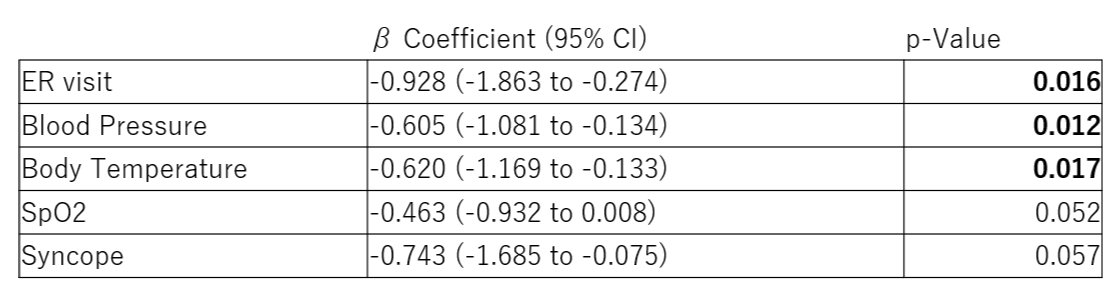
Results: Of 2,355 cases registered as PE, 1,737 were excluded. Of the 120 patients, 24 (20.0 %) were accessed as DE. The mean age was 64 years. 52 (43.3 %) were female, and 5 (4.2 %) patients deceased during the following hospitalization [Table 1]. In the logistic regression analyses, ER visit, frequency of recording blood pressure and body temperature in medical records were significant dependent variables (β coefficient: -0.928 [95% CI: -1.863 to -0.274], p=0.016; -0.605 [95% CI: -1.081 to -0.134], p=0.012; -0.620 [95% CI: -1.169 to -0.133], p=0.017) [Table 2]. As cause of errors, the most contributory items to error were 4A (Failure/delay in ordering needed tests, 25.0 %) in DEER, 1D (Findings masking/mimicking another diagnosis, 29.1 %) in RDC, and 6 (Counter-diagnosis cues overlooked, 33.3 %) in GDP. In the DE cases, 66.7% was classified as “Harm”.
Conclusions: The findings of this study indicate that the DE in PE was harmful. Furthermore, based on the root cause analysis of the DE, initiatives such as creating diagnostic checklists, reviewing cases where findings did not match the diagnosis, and ensuring critical findings are reliably documented in medical records may help prevent potential future errors.