Background: Hospital Medicine is a young and growing specialty. About 50% of our academic hospital medicine group of nearly 70 physicians are in their first 5 years out of residency. And about 90% of our faculty are millennials (born 1982-2000), the fastest-growing generation in the workforce and the first generation to grow up in a digitally connected world of continuous and nearly instantaneous information and feedback. Dashboards in hospital medicine are playing a growing role in driving performance. We developed and implemented an EHR based dashboard to provide feedback to our physicians regarding their performance and to align the individual, team and organizational goals.
Methods: We built a hospital medicine physician dashboard into EPICTM to provide near real-time reports on a variety of metrics chosen by our Performance Measurement Committee. After review of available data points, the committee decided to track 10 am discharges as a throughput measure, discharge summary completion within 24, 48 and 72 hours as a transitions measure, medication reconciliation completion as a quality of care measure and coding distribution as a financial measure.Early discharges from the wards allow for efficient movement of patients from the emergency room to the floors, decreasing ED boarding. We also measured 72-hour bounce backs to the ED and LOS as balancing measures for early discharges as well as CMI for severity adjustment. Timely discharge summaries improve the safety of the transition from hospital to outpatient settings. Each physician can view his/her detailed performance as well as group performance for each metric.After a 4-month run-in period (March 2019-June 2019) to test and refine the dashboard, we officially went live with the dashboard July 1, 2019, with the 10a discharge metric as the first to be actively managed. After 4 months, on November 1, 2019, we began to highlight the discharge summary completion metric.We performed a retrospective pre-post study comparing 10 am discharge performance from November 2018 to February 2019 and July 2019 – October 2019. For discharge summary completion we compared September and October 2019 with November 2019. Chi-squared analysis was used. A p-value of < 0.05 was considered significant.
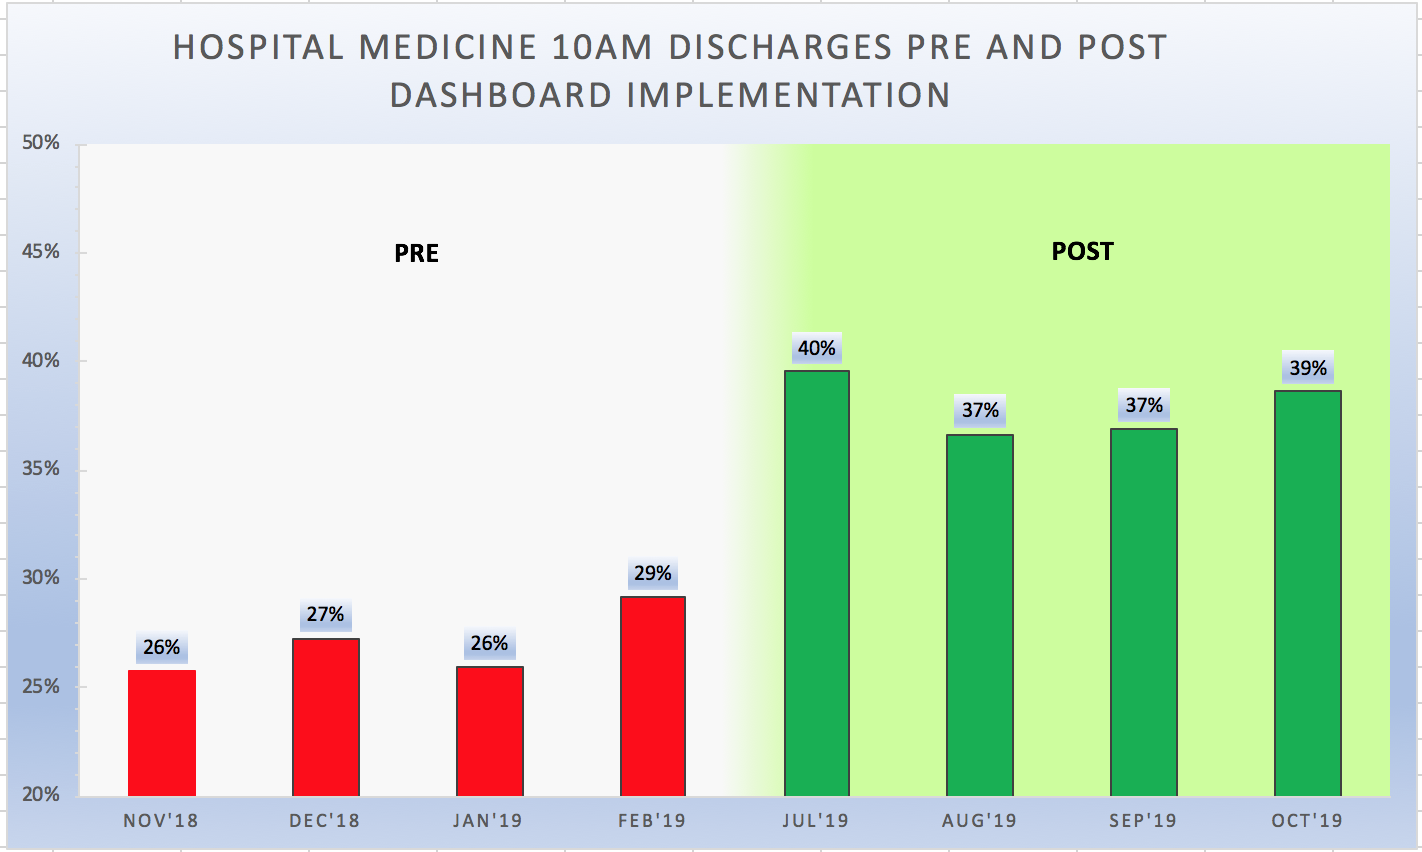
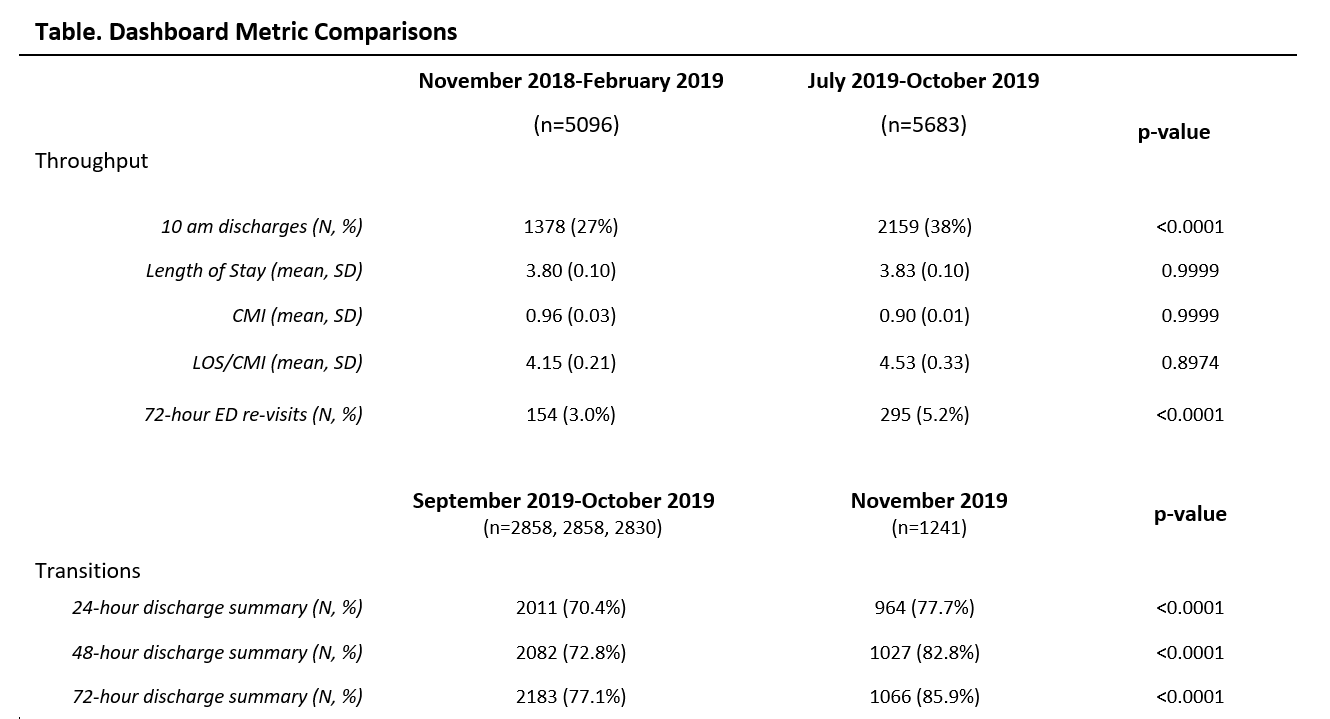
Results: 1378 of 5102 (27.0%) of discharge orders in the pre period were placed before 10am compared to 2159 of 5683 (38.0%) discharge orders in the post period (p<0.001) (Figure). LOS and CMI did not change from pre to post periods. 72-hour ED revisits increased from 3.0% to 5.2% (p<0.001). Discharge summaries completion at 24, 48 and 72 hours all improved from 70.4% to 77.7% (p<0.001) at 24 hours, 72.8% to 82.8% at 48 hours (p<0.001) and 77.1% to 85.9% (p<0.001) at 72 hours (Table).
Conclusions: We developed and implemented a real-time Hospital Medicine dashboard into our EHR to provide individual physicians near real-time feedback about their throughput and transitions performance. We witnessed a substantial increase in discharge orders placed before 10 am. However, it is unclear if this came at the expense of increased ED re-visits. After continuing to actively manage our throughput and transitions metrics, we plan to promote our quality and financial metrics. Future dashboard implementations may include patient experience, education, and research domains. Our dashboard appears to help satisfy our physicians’ desire for an objective, regular performance feedback, and goal setting.