Background: It is challenging to optimize patient care, throughput, and length of stay (LOS) when hospital departments do not know which components of a patient’s care plan are time sensitive. In our institution, fragmented communication and delays in imaging hinder timely patient care and discharge, impacting both observation and inpatient LOS. This may also impact patient satisfaction. We developed a Microsoft Excel-based dashboard to process raw data to uncover actionable delays of care, aiding transparency and accountability across departments.
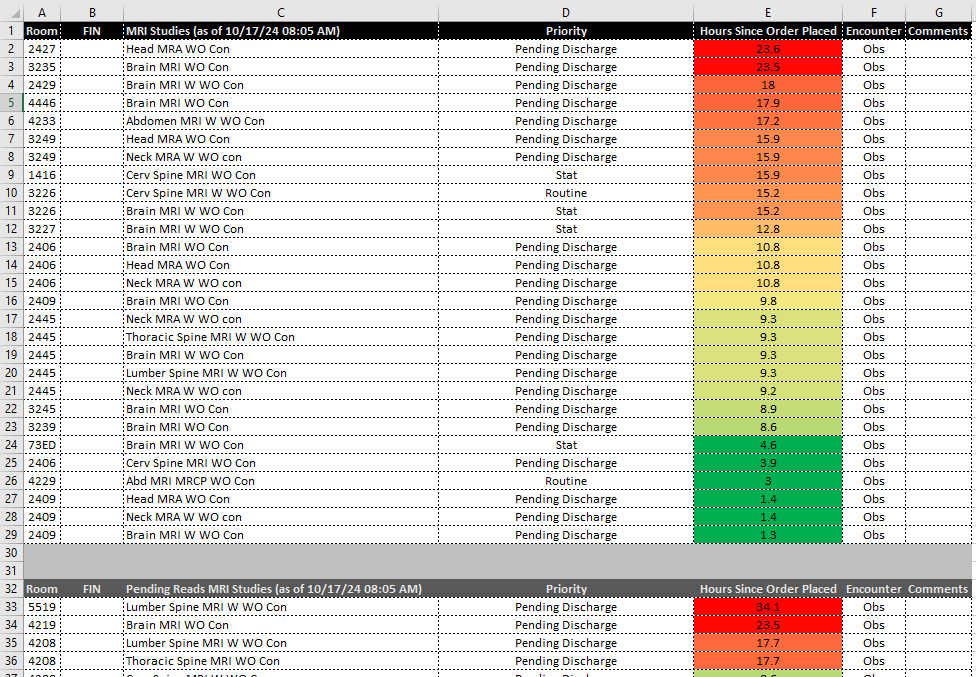
Purpose: This project aimed to create a twice daily dashboard that supports proactive patient management by:1. Highlighting delays in individual patient imaging with color-coded urgency indicators.2. Setting standard performance expectations with hospital departments for each type of study.3. Enabling twice-daily communication to department heads for timely escalations.
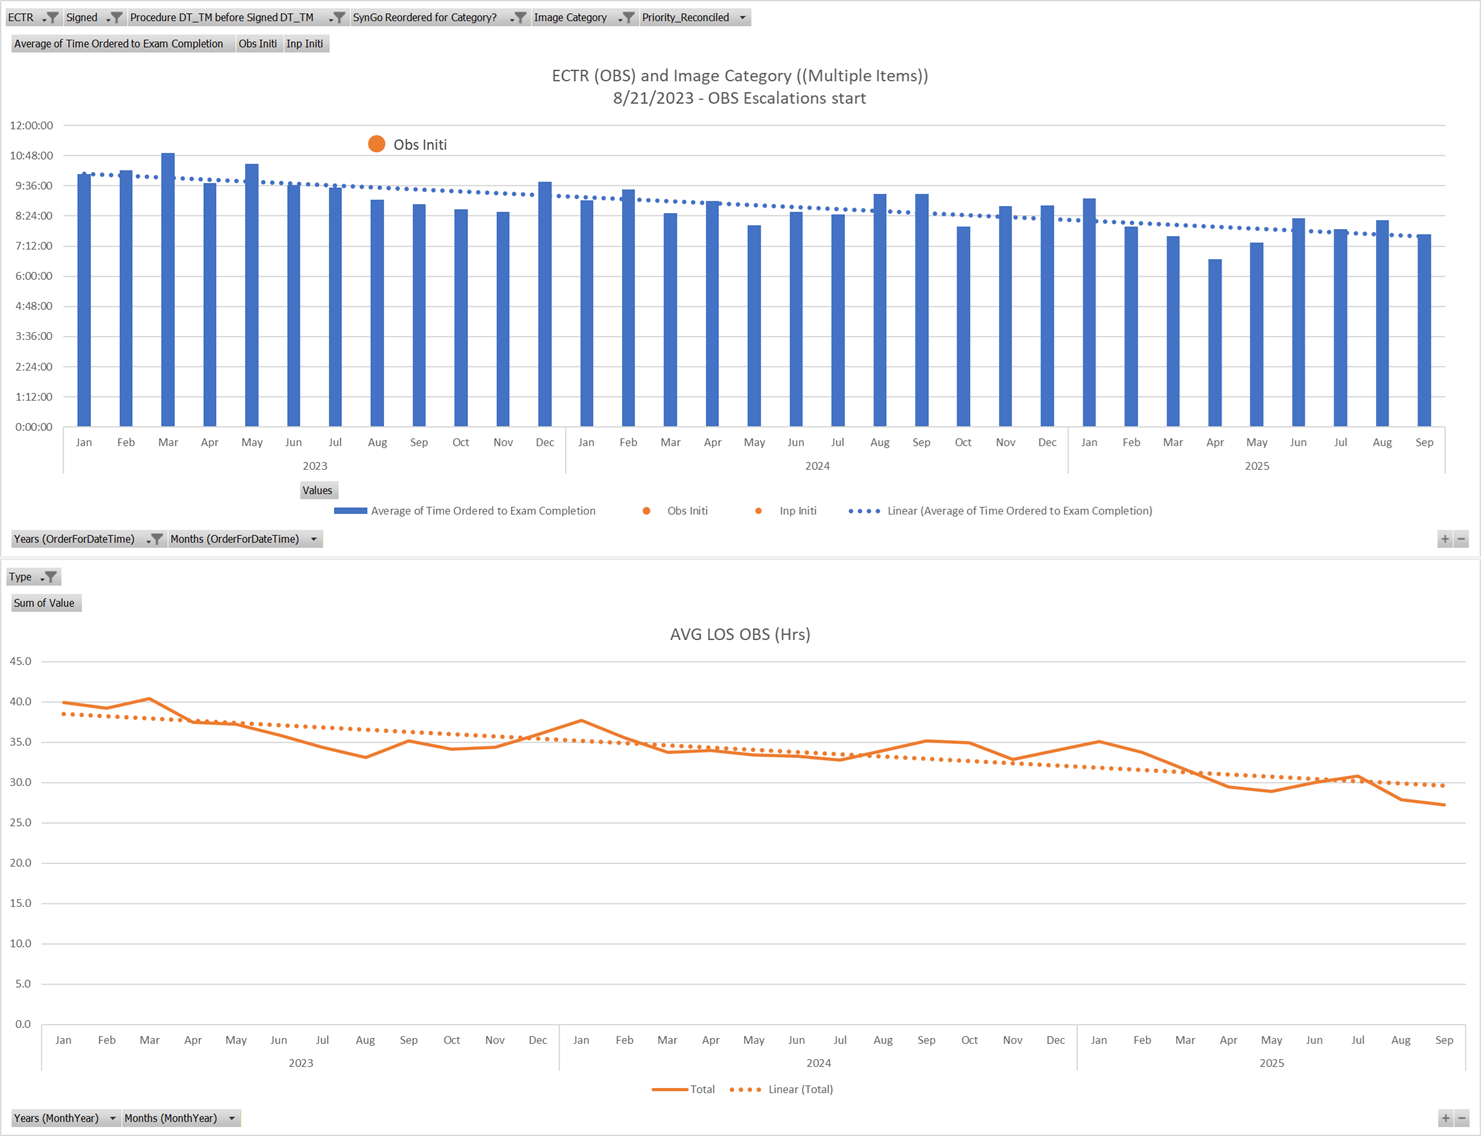
Description: We used Cerner PowerChart / Discern Reporting to obtain relevant, contemporaneous raw data on imaging orders, imaging final read status, and discharge status linked by encounter numbers. Data are pasted into Excel sheets that automatically populate dynamic tables, grouping and filtering/sorting items by encounter type, study status, and elapsed time. Also displayed are elapsed time for orders, current LOS, and expected LOS, with color coding to signal urgency based on department-agreed time thresholds.These were called “escalations” and were emailed to department heads twice daily. Initial implementation on the observation service was correlated with improved LOS for observation patients, and after that success, it was applied to the inpatient service line. Department heads and executive leadership provided feedback indicating substantial improvements in coordination and accountability.
Conclusions: This Excel-based dashboard is a tool that uncovers delays of care of individual imaging orders to improve hospital throughput. By showcasing inter-departmental coordination, this tool can serve as a model for other hospitals seeking cost-effective solutions to optimize patient care and length of stay. Future work may focus on impacts on patient satisfaction and evaluating actual cost savings.