Background: Few hospital medicine physicians receive formal instruction on coding for inpatient evaluation and management (E&M) services. When feedback on billing practice is provided, it tends to focus on coding accuracy relative to clinical documentation requirements, but with varying results. An individual physician scorecard with peer group comparisons may more reliably influence coding behavior.
Methods: Physicians in the Division of Hospital Medicine at Akron Children’s Hospital were provided quarterly scorecards detailing their relative percentages selecting a specific Current Procedural Terminology (CPT®) code from among the acute inpatient services code groups (i.e., initial inpatient, subsequent inpatient, discharge inpatient, initial observation, admit/discharge same date, and consult inpatient). Division averages as well as national benchmarks published by the Society of Hospital Medicine were also provided. The work relative value unit to total encounter (wRVU/TE) ratio, a single measure capturing coding intensity, was calculated and graphically displayed for each Division member in blinded fashion. Coding intensity the year before (2015) and the year after (2016) the intervention was compared. Continuous variables were described as median and interquartile ranges. Wilcoxon signed-rank test assessed differences in the wRVU/TE ratios between 2015 and 2016 as well as the absolute change in wRVU/TE ratio from 2015 to 2016. Levene’s test for equality of wRVU/TE ratio variances between 2015 and 2016 was applied. The level of significance was set at 0.05.
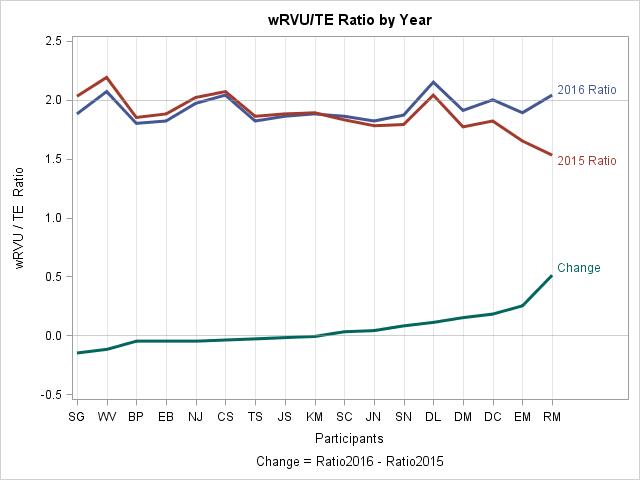
Results: There were 17 Division members with data points available for both years. The median wRVU/TE ratio was 1.86 (1.53 – 2.19) and 1.88 (1.80 – 2.15) in 2015 and 2016, respectively. The Wilcoxon signed-rank test indicated that the distributions of 2015 and 2016 wRVU/TE ratios were not statistically different (P =0.4941, median change -0.01 [95% CI: -0.05; 0.11]). The Wilcoxon signed-rank test did, however, reveal that the absolute change in wRVU/TE ratio from 2015 to 2016 was different from 0 (P < .0001, median absolute change 0.05 [95% CI: 0.04 – 0.15]). Levene’s test indicated no statistical difference in the variances of wRVU/TE ratio between 2015 and 2016 (P = 0.1284, Var2015 = 0.026, Var2016 = 0.011). However, variance of wRVU/TE ratio decreased in 2016.
Conclusions: Implementation of an individualized scorecard can influence physician CPT® code selection and was shown to decrease billing variation among a cohort of pediatric hospitalists.