Background: The existing literature suggests there is no significant difference in risk adjusted inpatient mortality between patients whose preferred language is English and those who preferred a non-English language.1 However, these studies typically exclude patients with missing language data from analysis.
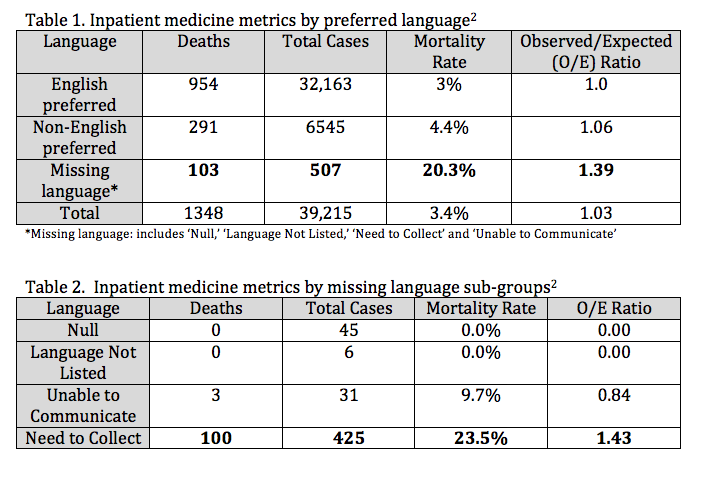
Purpose: In our health system, missing language data is specified in the electronic health record (EHR) as either ‘Null (blank),’ ‘Language Not Listed,’ ‘Need to Collect,’ or ‘Unable to Communicate.’ While patients with missing language data accounted for a small proportion (1.3%) of all inpatient medicine admissions across our health system in 2022, this group had a substantially higher crude and adjusted mortality rate when compared to those with a preferred language identified (table 1). Within the missing language group, mortality differences were also observed (table 2). As such, we felt it important to further investigate this high mortality population. Our objective was to describe the demographics of this missing language population and assess the impact of this group on inpatient mortality.
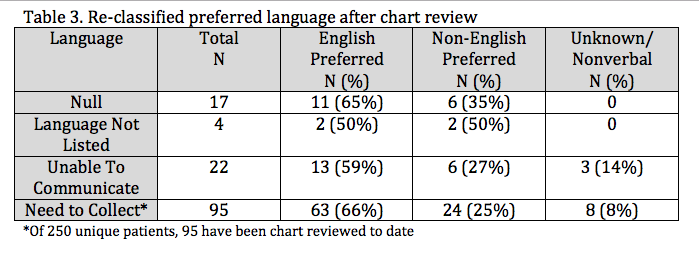
Description: In 2022, there were 507 medicine admissions across our health system with missing language preference (includes ‘Null,’ ‘Language Not Listed,’ ‘Need to Collect,’ or ‘Unable to Communicate’). After removal of duplicate admissions, 294 unique patients comprised this cohort. We attempted to identify the preferred language through retrospective chart reviews for interpreter use and targeted review of chart notes. Patients were then re-classified as English or non-English preferred. In the absence of corroborating chart documentation, patients remained categorized as ‘unknown language.’We were able to identify the preferred language of 138/294 patients who were initially categorized as having missing language data, including all of those in the ‘Null,’ ‘Language Not Listed,’ and ‘Unable to Communicate’ categories (table 3). Of the 250 patients in the ‘Need to Collect’ group, 95 charts were reviewed thus far. Of those, 63 (66%) were determined to have English preference, 24 (25%) had a non-English preference, 3 were non-verbal at baseline and 5 remained ‘unknown’ despite chart review (8% combined). In many cases, initial categorization as missing language appeared to reflect severity of illness on presentation. Preliminary findings suggest that English was the most common language preference of the missing language cohort. However, the percentage of those with non-English language preference in this cohort was higher than in the original sample (28% vs.17%).
Conclusions: Meaningful equity analyses require accurate demographic information and inclusion of all populations. Every attempt should be made to capture and update this information with each health care encounter. We found it feasible to identify preferred language through chart review and that missing language was frequently a marker of illness severity on presentation. Next steps include assessing the impact of our re-classified missing language cohort on mortality rates and investigating the commonalities of this group to identify potentially actionable disparities surrounding the hospitalization.