Background: There is growing interest in the use of artificial intelligence (AI) predictive models in hospital medicine. However, real-world implementation and evaluation of AI models lags the development of such models, with many such models being developed but never used in live practice. (1) Therefore, relatively less is known about the performance of these models in real-world clinical practice, particularly over longer time horizons and across multiple implementation sites. We developed an AI model using eXtreme Gradient Boosting (XGBoost) to predict which emergency department (ED) patients might ultimately require hospital admission, which we have reported elsewhere. (2,3) The ultimate goal of implementing this model is to increase disposition efficiency, specifically, expediting hospital admissions, discharges to home, and interhospital transfers.
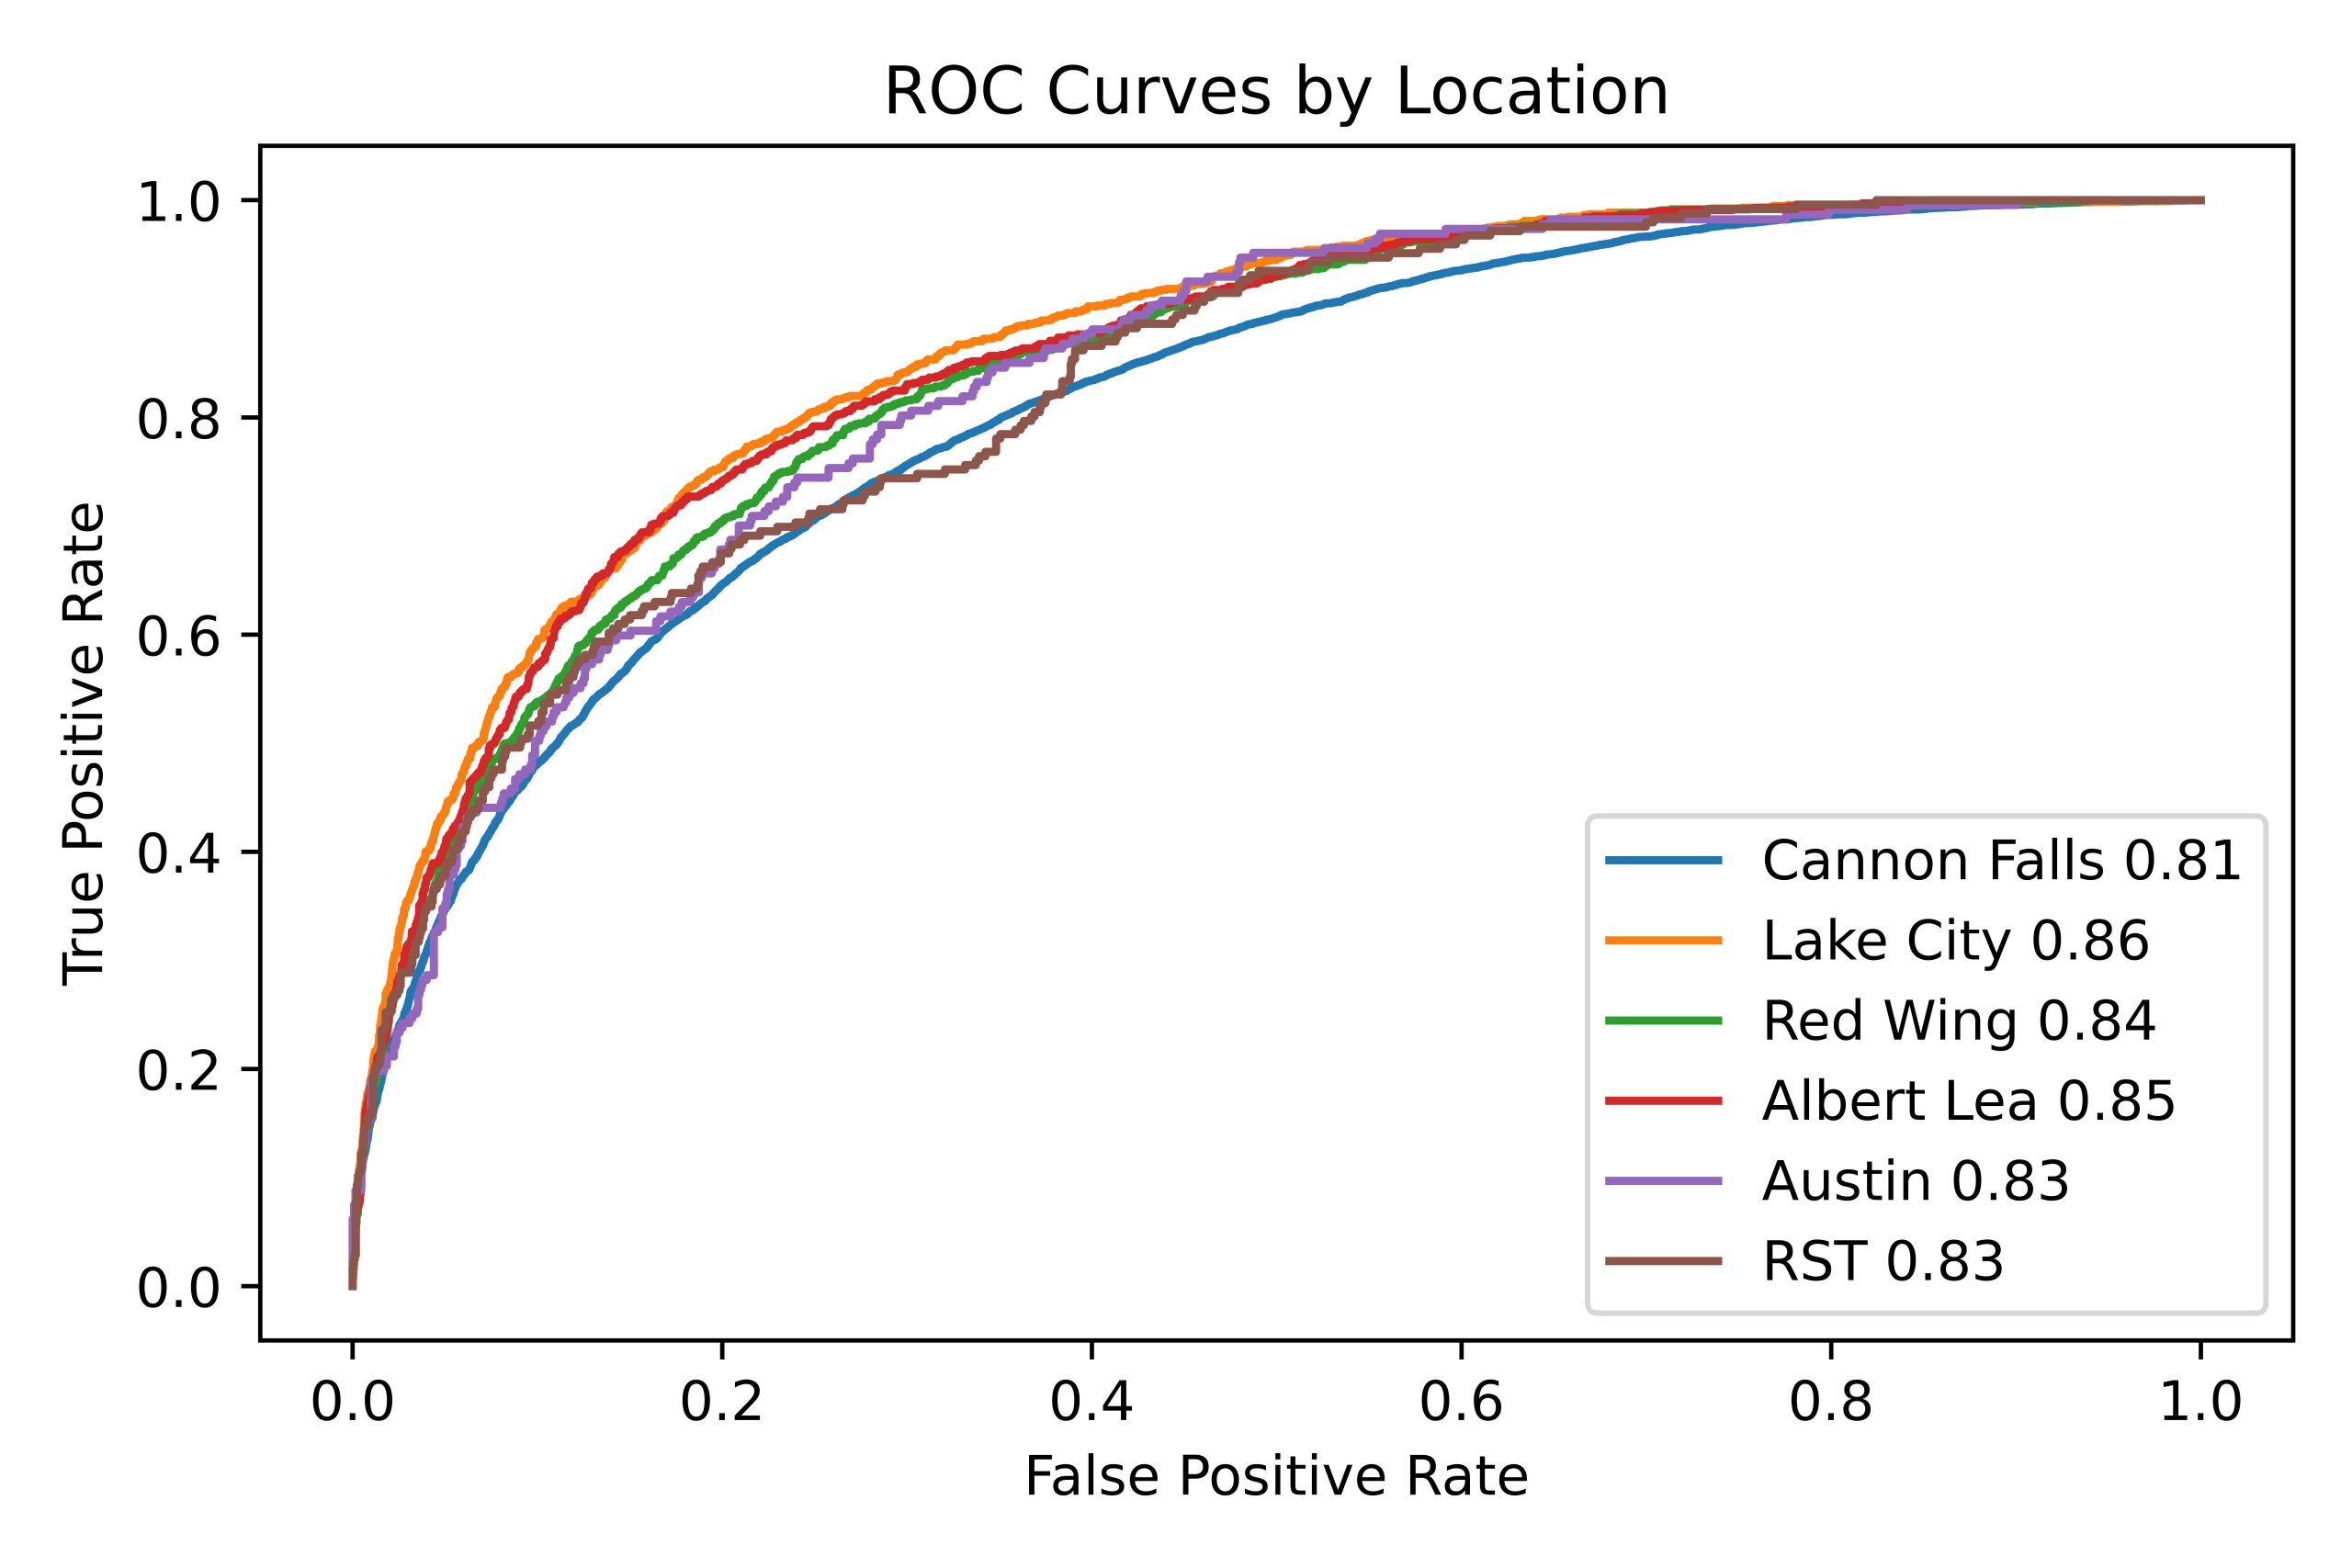
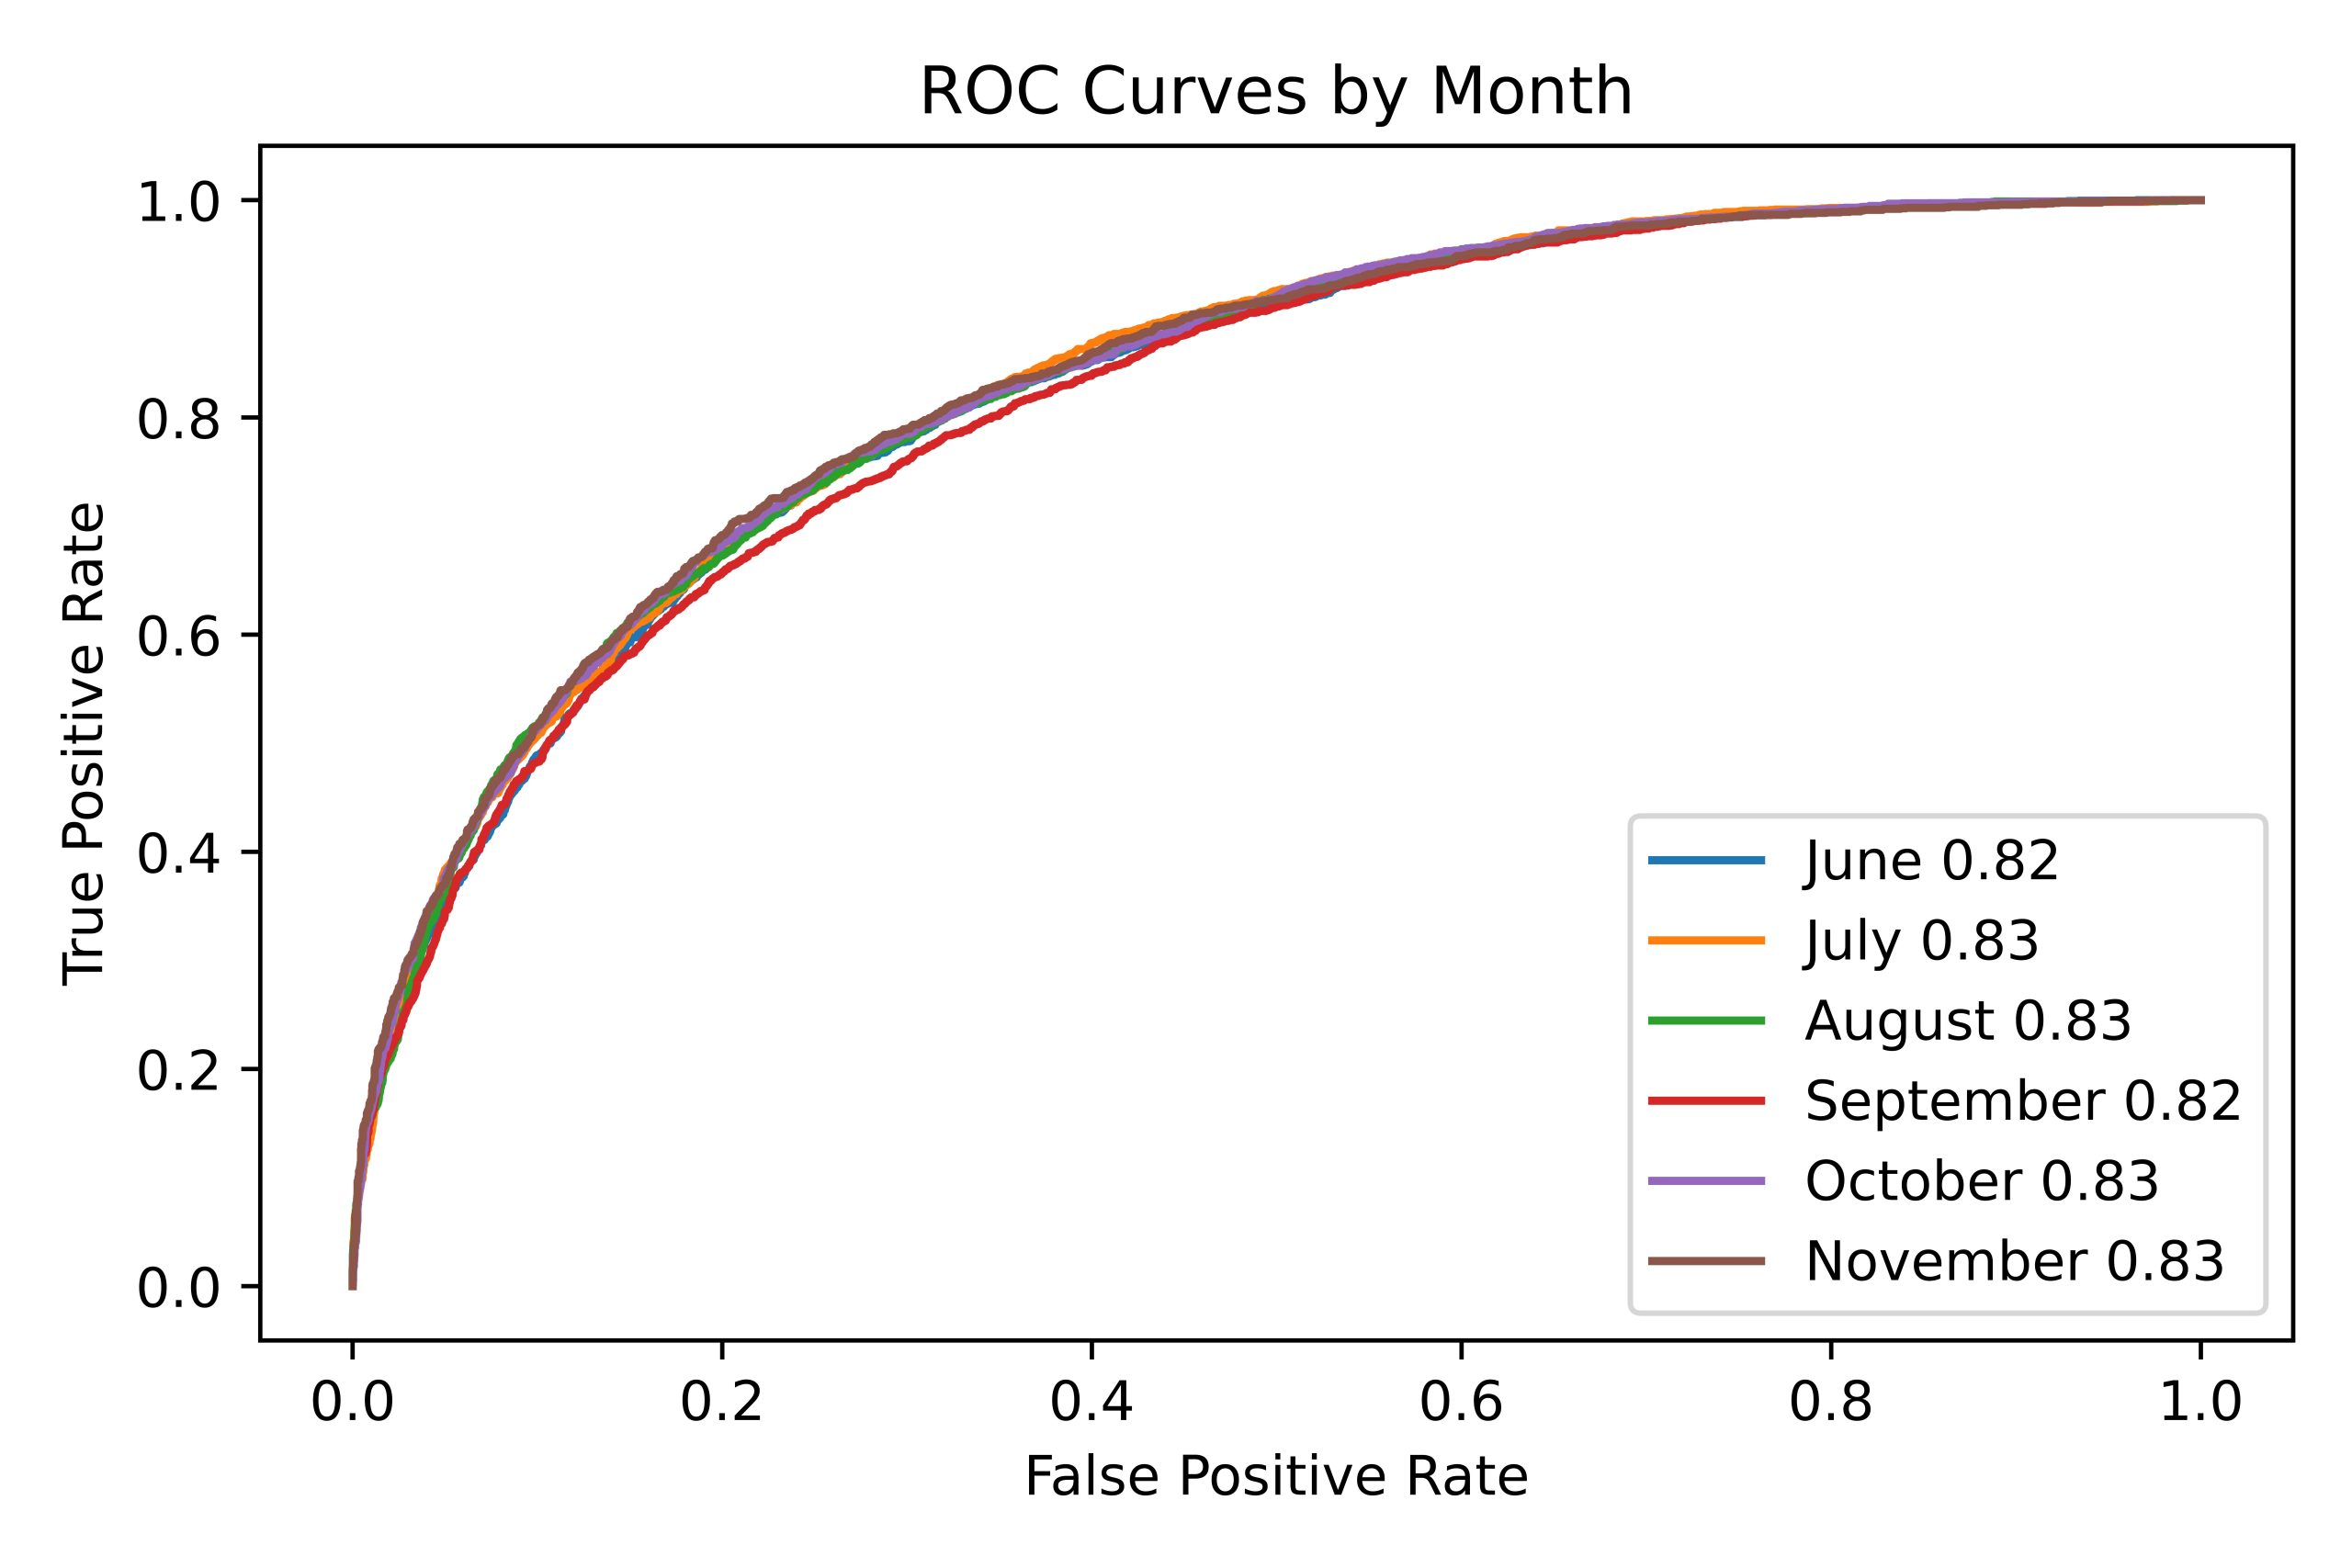
Methods: We implemented an AI model for predicting ED admissions at six diverse ED sites belonging to the same healthcare system. The hospitals affiliated with these EDs ranged in capabilities from quaternary referral center to critical access hospital as follows: Rochester, MN – tertiary referral, Austin, MN, Red Wing, MN and Albert Lea, MN – community hospitals, and Lake City, MN and Cannon Falls, MN – critical access hospitals. Go-live dates for implementation ranged from January 2023 – May 2023, as interest spread between sites. We report the most recent 6 months’ performance in order to capture comparable data from all sites. Statistical assessments included per-site area under the receiver-operator curve (AUC) over the six-month period as well as per-month AUC aggregated across all sites.
Results: Over the data collection period, the number of patients seen and admitted per ED was: Rochester, MN – 34038 visits, 10746 admitted; Austin, MN – 8254 visits, 1309 admitted; Albert Lea, MN – 6836 visits, 1183 admitted; Red Wing MN – 6925 visits, 1004 admitted; Lake City, MN – 1524 visits, 227 admitted; Cannon Falls, MN – 1978 visits, 246 admitted. Across sites, AUC ranged from 0.81 – 0.86, demonstrating adequate predictive performance at each site (Figure 1). By month, AUC ranged from 0.82-0.83 when aggregated across sites, suggesting that model performance remained stable (Figure 2).
Conclusions: An AI model for predicting which ED patients will require hospital admission demonstrates real-world performance that is stable over a six-month data collection period, and is relatively consistent across diverse ED sites. We suspect that this is attributable to a combination model-specific factors, such as including generalizable and clinically relevant features, and institution-specific factors, including the excellent degree of data harmonization that has been implemented across our ED sites.